Contents
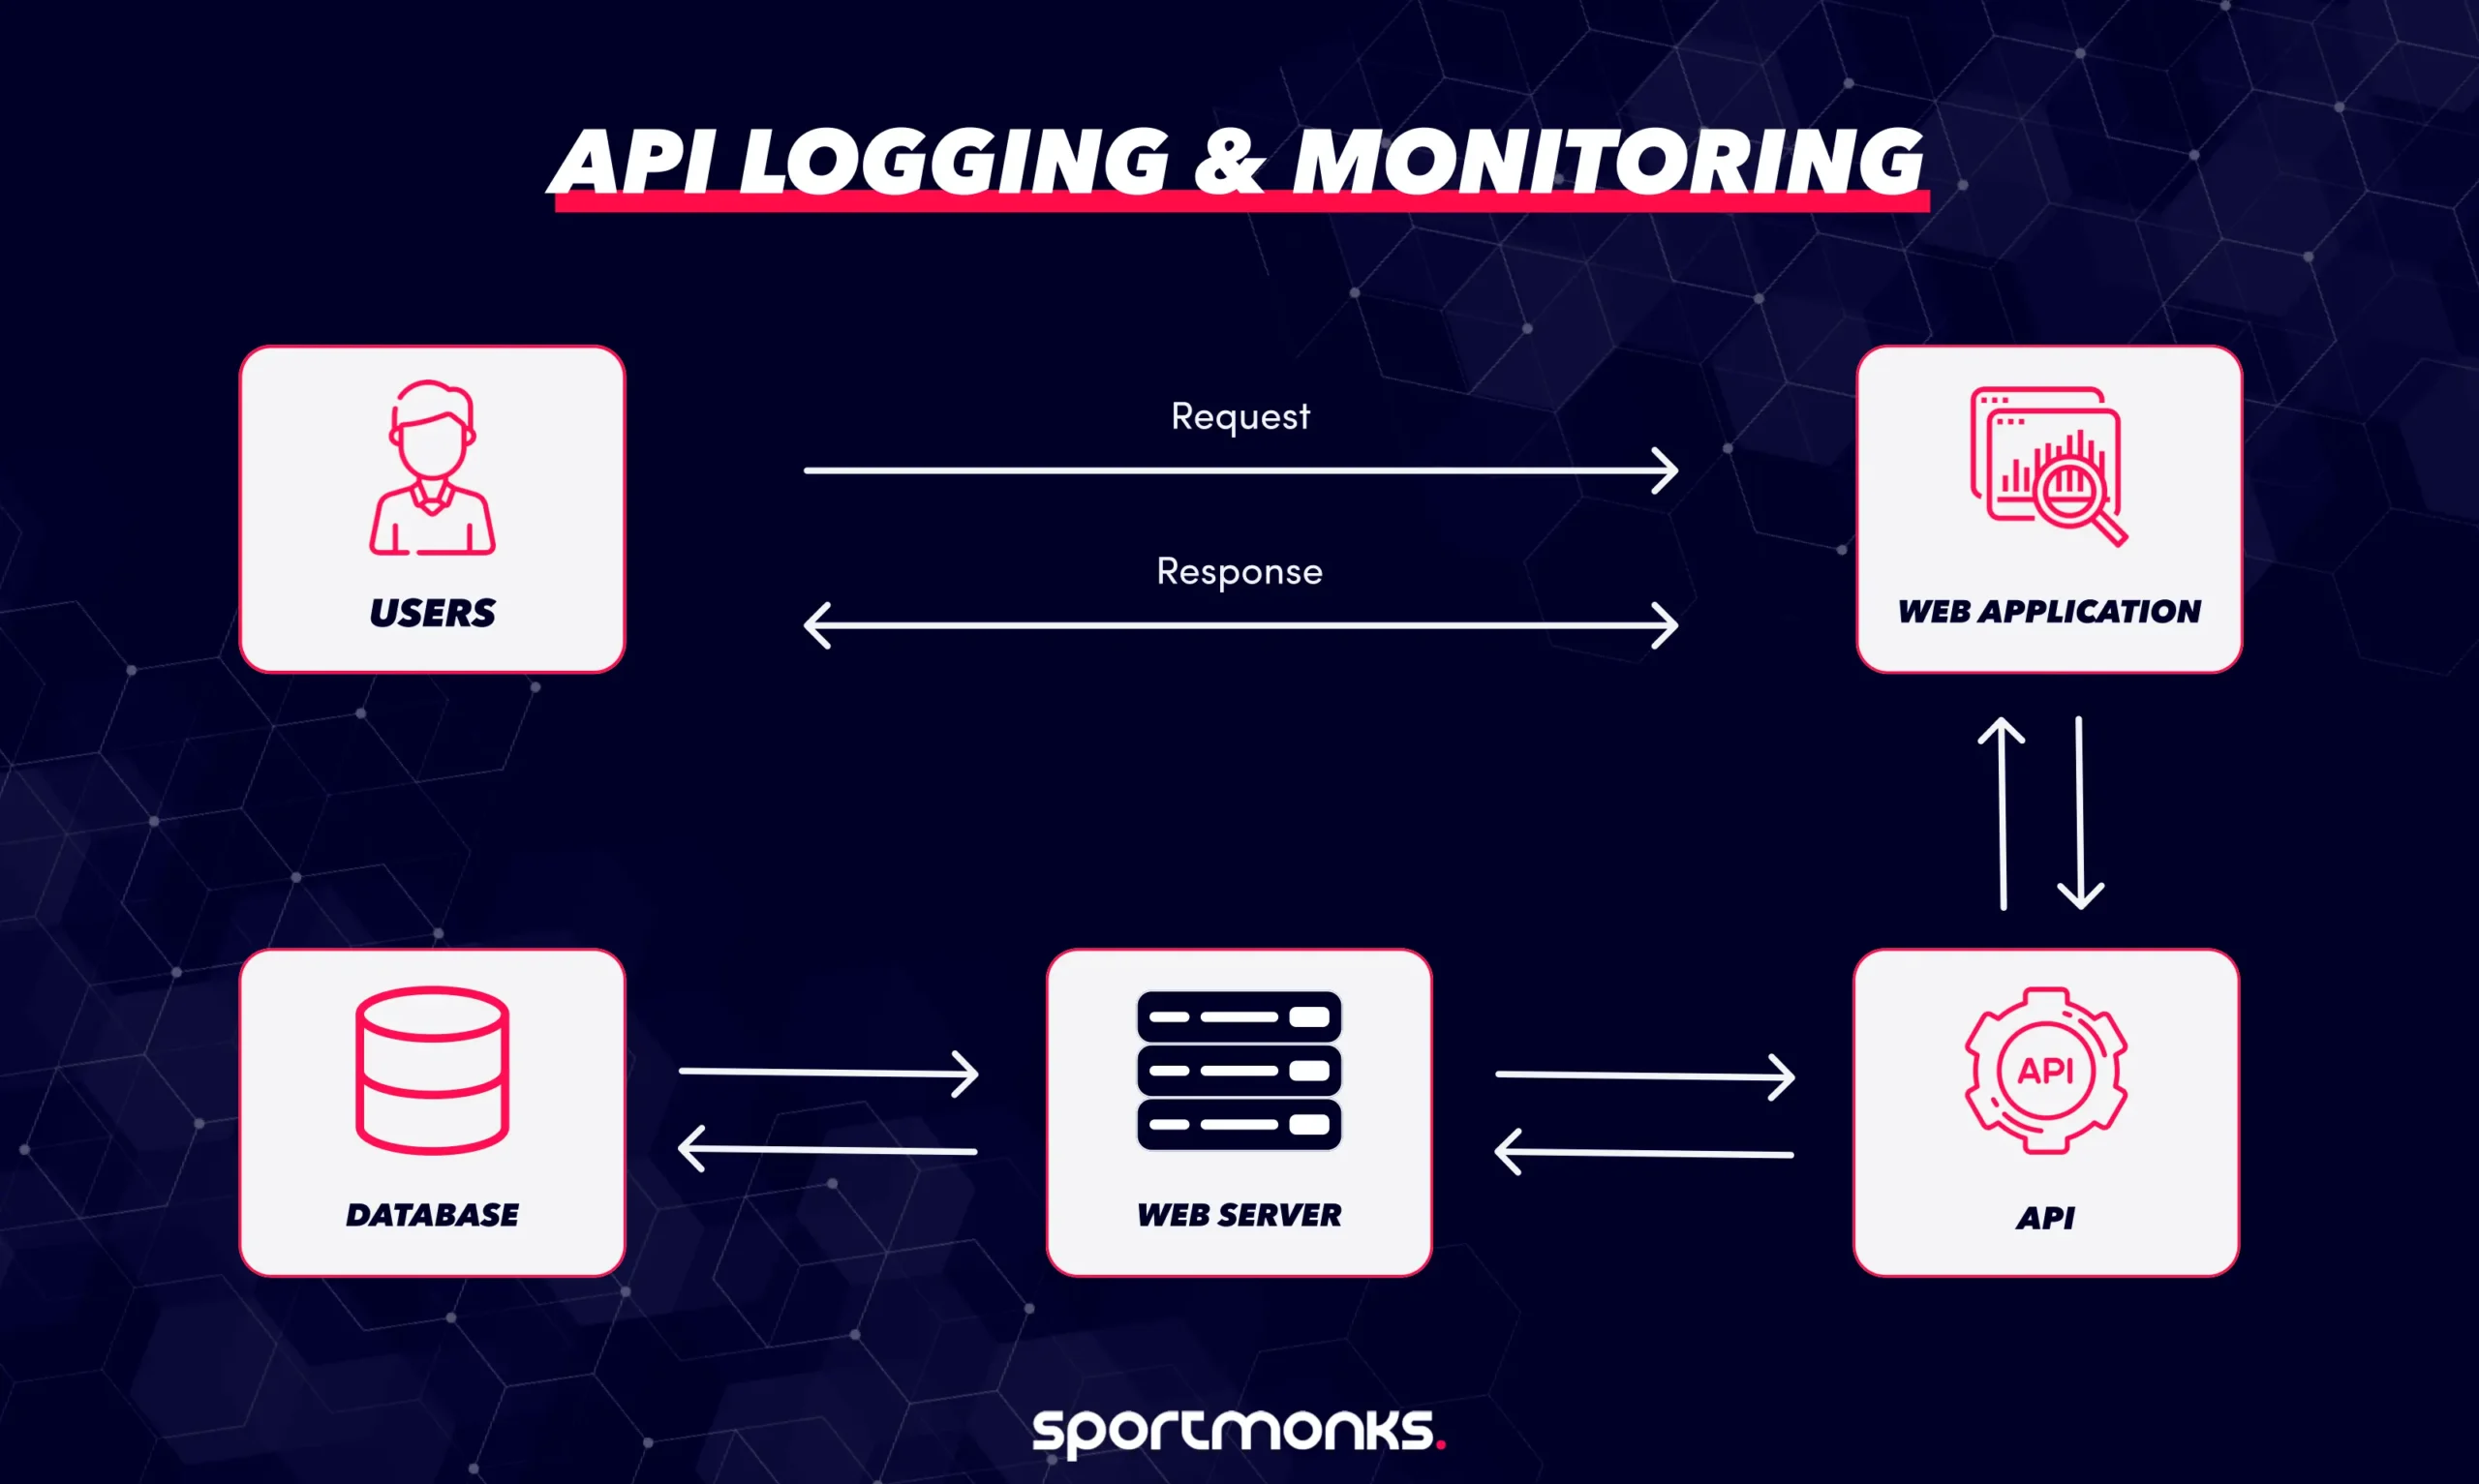
Key concepts in API monitoring
Recording events
– Log entry: This is a single, recorded instance of something happening when the API is called. It captures details like the time the call was made, which service was used (endpoint), the data sent or received, and whether the call was a success or a failure (status).
– Correlation ID / Request ID: This is a unique code attached to every single request made by a user. This ID is essential because it allows analysts to link together all the related logs, metrics, and traces across the entire system, making it easy to follow one user’s complete action.
– Trace: This is a complete, full-path record of a request’s journey. It shows exactly how the request travelled through all the different services it needed, highlighting where time was spent or where delays occurred.
Measuring performance
– Metric: This is a measurable piece of data derived from the API’s operations, used to track performance. Key examples include the total number of requests, the latency (how fast the API replied), and the error rate (the percentage of calls that failed).
Classifying severity
– Log Levels: These are categories used to organise and prioritise the importance of recorded events (logs):
ERROR: Used for critical failures (something is seriously broken).
WARN: Used for warnings (signs of possible trouble that didn’t cause an immediate failure but should be investigated).
INFO: Used for normal operations (a record of what the system is doing day-to-day).
DEBUG/TRACE: Used for highly detailed diagnostic data needed by developers when troubleshooting a specific, complex issue.
What information to record in API logs
When monitoring an API, logging the right details is essential for identifying problems, tracking performance, and seeing who is initiating calls.
– Request details: Record exactly what the user was trying to do. This includes the HTTP method (like GET or POST), the specific endpoint or path being accessed, any query parameters, and the contents of the request body (what data was sent).
– Response details: Capture the result of the API call. This means recording the HTTP status code (e.g., 200 for success, 404 for not found, 500 for error), the size of the response data, and any specific error messages given to the client.
– Time information: Track how fast the API is running. Log the timestamps for when the request was received, when processing finished, and the overall latency (total response time). This is crucial for performance monitoring.
– Client context: Identify who made the call. Include the client’s IP address, the user identity (if they are logged in), and the type of software they used (user-agent string). Always mask or hide sensitive details like authentication tokens.
– System context: Identify where the request was processed. Log the server or instance ID, the environment (production, staging, etc.), and the API version being used. This is vital for debugging in large systems.
– Correlation or request ID: Make sure every single request carries a unique identifier. This correlation ID links all the logs, metrics, and traces together across different parts of your system.
Structuring and storing API Logs
To make your logs useful for analysis and security, they need to be organised and stored properly.
Structuring for analysis
– Structured format: Logs must use a consistent, computer-readable format like JSON (JavaScript Object Notation), instead of messy free-text entries. This makes searching, filtering, and analysis much faster and simpler.
– Indexing and querying: Ensure your logs are stored in a way that allows for fast filtering and searching. You should be able to efficiently search by key information like timestamp, log level, or request ID.
Storage and management
– Centralised storage: Gather all logs from every API service into a single, central logging system. This avoids leaving logs scattered across individual servers, which supports unified searching and alerting across your entire system.
– Retention and rotation: Define how long logs need to be kept (based on legal and business needs). Implement log rotation by moving older logs to cheaper, archived storage or deleting them completely to manage costs.
– Storage tiers and cost: To keep costs down, consider using tiered storage. This means keeping recent, high-value data instantly accessible (“hot” storage) while moving older, less-frequently accessed logs to cheaper archives (“cold” storage).
Security
– Security of log data: Even though logs help with security, they need protection themselves. You must encrypt logs both when they are stored (at rest) and when they are being moved (in transit). You should also strictly control and audit access to the log system.
Monitoring APIs: Metrics and health
To ensure your API is running smoothly and meeting user expectations, you need to track specific performance indicators.
Key operational metrics
These are the most important numbers to track for API health:
– Request rate (Throughput): How many requests your API is handling per second or minute. This tracks the total volume and traffic load.
– Latency / response time: How long it takes for the API to process a request and send a response. This is often tracked using percentiles (e.g., p95 or the 95th percentile) to measure the experience of almost all users, not just the fastest ones.
– Error rate: The percentage of requests that fail. You should specifically track failures caused by the client (4xx codes) and failures caused by your server (5xx codes).
– Availability / uptime: The amount of time your API is working and reachable.
– Saturation: How close your servers or resources (like CPU or memory) are to their limits. This tells you when you need to upgrade capacity.
Service targets and analysis
– SLIs and SLOs: You should define clear targets, called Service Level Indicators (SLIs), such as “95% of replies must be sent in under 200 milliseconds.” Then, you set Service Level Objectives (SLOs), which is the guarantee you make to your users (e.g., “We aim to meet that 200ms target for 99.9% of all requests.”). This connects monitoring to business goals.
– Anomaly detection: Don’t rely only on simple, static limits (like “alert if errors hit 5%”). Use historical data to automatically detect unusual spikes in latency or error rate, which helps you catch problems sooner than a simple threshold would.
Coverage
– Context and scope: Ensure you aren’t just looking at overall averages. You need to monitor performance across specific endpoints, different geographic regions, varying client types, and separate environments (like production versus staging) to pinpoint the exact location of a problem.
Alerts, dashboards, and observability
To manage an API effectively, you need tools that tell you when something is wrong and give you the context needed to fix it.
Alerting
– Setting the conditions: You must set thresholds and conditions to notify your operations team when a problem arises (e.g., “Alert if the error rate stays above 5% for five minutes”).
– Avoiding fatigue: It’s important to balance how sensitive your alerts are to avoid generating too much noise. Getting too many alerts (alert fatigue) means teams start ignoring the warnings, even the critical ones.
– Routing: Ensure alerts reach the right person immediately, classify them by severity, and integrate them directly into your existing incident-management process.
Dashboards and visualisation
– Quick health check: Dashboards are visual displays of your key metrics, latency, throughput (request rate), error rate, and uptime. These allow teams to quickly assess the system’s current health and spot unusual trends or sudden spikes in errors.
– Real-time vs. historical: Dashboards should offer both a real-time snapshot of what’s happening right now and a view of historical trends. This helps you detect problems as they emerge and perform detailed root-cause analysis after an incident has occurred.
Observability and context
– The holistic view: Observability is a powerful concept that combines your logs, metrics, and traces into one holistic view. This gives you the full context of what your system is doing, how it’s performing, and, most importantly, why something failed, not just that it failed.
– Correlation: A crucial part of observability is the correlation of telemetry (data). By linking logs, metrics, and traces together (often using the correlation ID), you can follow a single user request from end to end and pinpoint exactly where an issue is happening within your service architecture.
– Continuous improvement: Data gathered through observability should constantly feed back into your system. Use it during post-incident reviews to refine your service targets (SLIs), update your alerting rules, and improve your code instrumentation over time.
Security, Compliance, and Privacy for API Logs
Protecting the data within your API logs is just as important as protecting the API itself. Here are the key considerations for security and legal compliance.
Protecting sensitive data
– Masking and anonymising: You must never log full personal data like names, payment card numbers, or health information. Instead, apply techniques like masking (hiding parts of the data), hashing, or tokenisation to replace sensitive information with a non-sensitive equivalent.
– Minimising data: Balance the level of detail with necessity. Too much logging, or logging personal data unnecessarily, raises costs, increases privacy risk, and can degrade performance. Only log what you absolutely need for diagnosis and security.
Access control and encryption
– Encryption: Protect your log data by ensuring it is encrypted both when it is stored (at rest) and when it is being moved between systems (in transit).
– Access control: Ensure only authorised roles can view or modify log records. Access to logs must be strictly controlled and audited.
Compliance and retention
– Audit trails: To comply with regulations (like GDPR, HIPAA, or PCI DSS), your logs must capture key fields, such as the user identity, timestamp, API endpoint, and request status. This creates a reliable audit trail that allows you to trace access, changes, and potential abuse.
– Retention and deletion policies: Define clear rules for how long to keep logs, ensuring these rules meet both business needs and legal requirements. You must also establish procedures for securely deleting or purging old logs when they are no longer needed.
Best practices for API Logging
To get true value from logging and avoid technical headaches, follow these guidelines:
– Define clear goals: Before you write any log statement, decide why you’re logging (e.g., to speed up incident response, track usage, or meet compliance needs). This stops you from logging without purpose.
– Use log levels correctly: Apply severity levels (INFO, WARN, ERROR, DEBUG) consistently. This helps you and your team quickly prioritise what matters most when an alert comes in.
– Use structured logging: Store all logs in a consistent, machine-readable format like JSON. This makes them much easier for tools to search, filter, and analyse later on.
– Centralise your logs: Gather logs from all services and endpoints into a single, unified system. This is crucial for correlating data across different services and finding the root cause of an issue faster.
– Protect data & comply: Mask or anonymise sensitive or personal data in your logs. Strictly control access and apply encryption (when storing and sending logs) to ensure security and meet regulations.
– Review and evolve: Regularly check if your logging setup is still effective, cost-efficient, and tuned for your current system architecture.
Pitfalls to avoid
Steer clear of these common mistakes to save time and money:
– Logging everything indiscriminately: Without focus, you’ll create massive volumes of log data. This leads to high storage costs, noisy alerts, and incredibly slow investigations.
– Over-verbose logs in production: Debug or trace logs are useful during testing, but in live systems, they clutter the logs, add little value, and complicate your alerting system.
– Ignoring performance or cost: Logging itself can become an expensive bottleneck if your process for gathering and storing data is inefficient.
– Logging sensitive data: Never log user passwords, full personal data, or authentication tokens in plain text. This is a major security risk and guarantees compliance breaches.
– Using inconsistent or decentralised logs: If logs are scattered or use different formats, search and correlation become extremely difficult, which drastically slows down fixing a live incident.
– Neglecting retention: Not keeping logs for long enough means you can’t investigate historical issues or meet audit requirements. Keeping them for too long drives up unnecessary storage costs.
How Sportmonks fits into your API Monitoring
The Sportmonks API is a core external service for your application, providing essential data like live scores, stats, and odds. Because you rely on this data, logging and monitoring your usage of the Sportmonks endpoints is crucial for your overall system health.
What to log when calling Sportmonks
When your application makes a call to the Sportmonks API, you should record the following details in your logs:
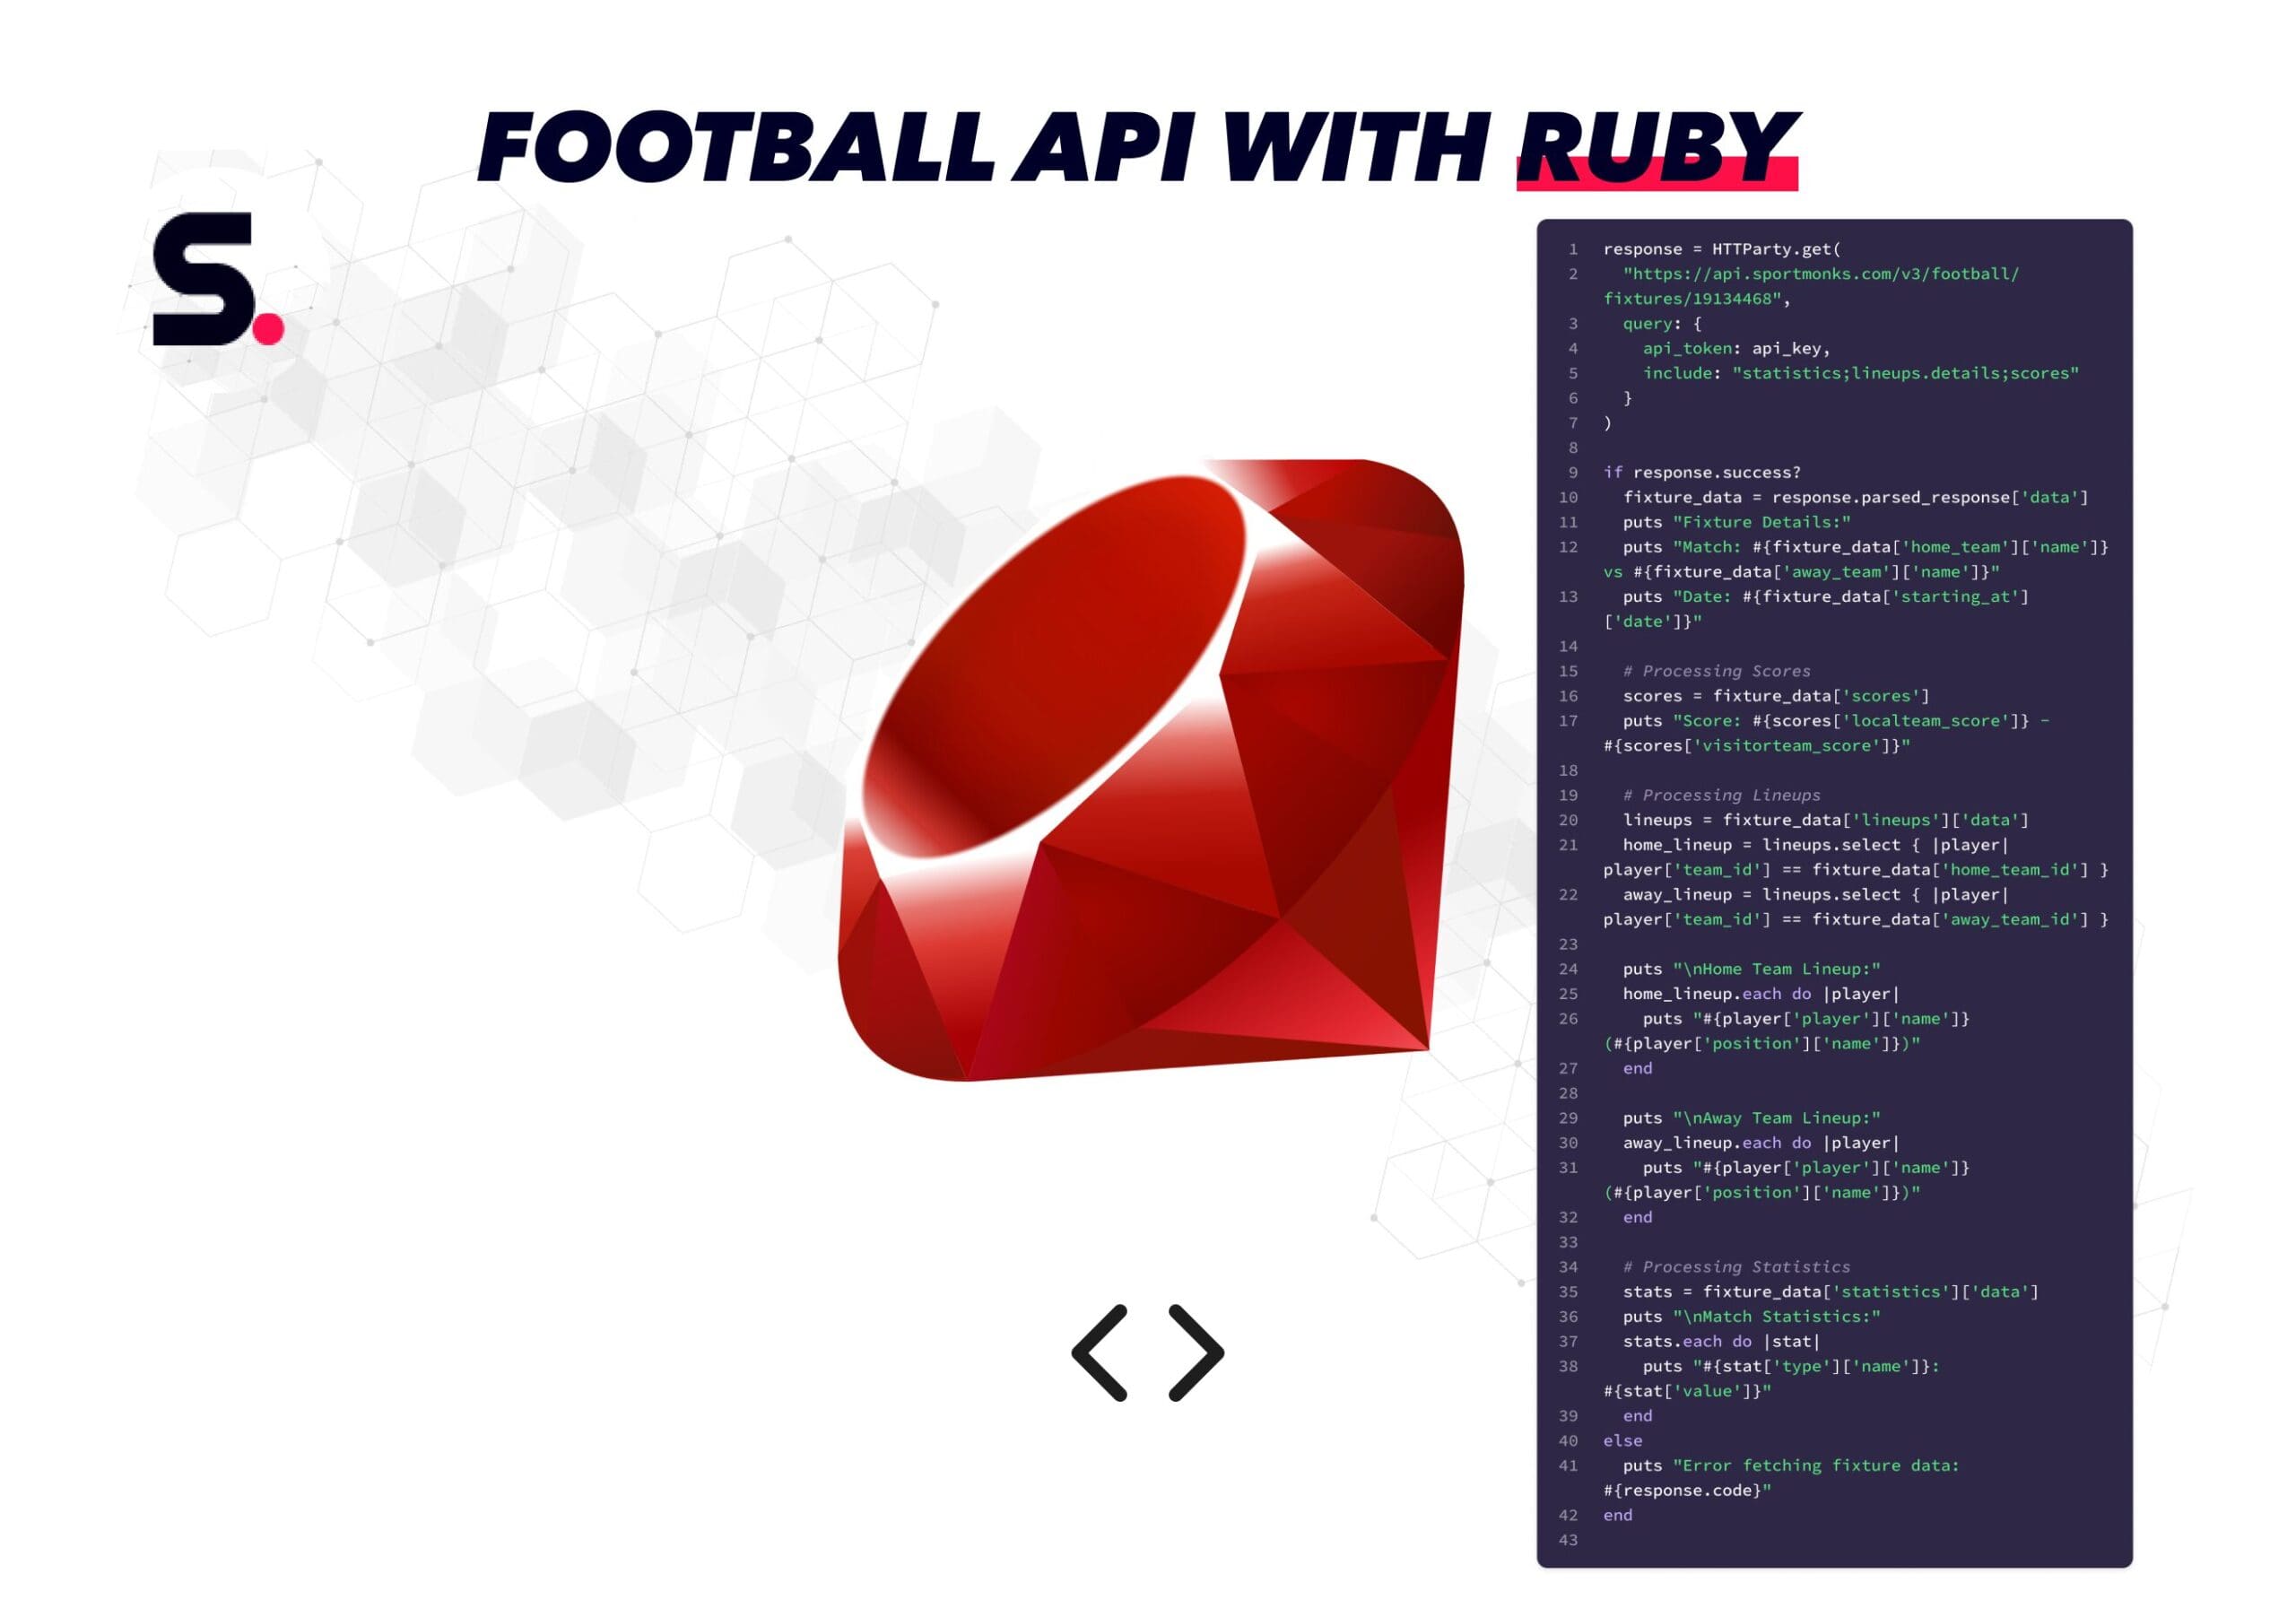
– Request & Response: Log the HTTP method (e.g., GET), the specific endpoint (e.g., /v3/football/fixtures), the query parameters, the final status code (e.g., 200, 429), and the size of the data received.
– Latency: Always capture the latency (how long the API call took to complete).
– Includes tracking: Record which ‘includes’ were used in the request. Since ‘includes’ can increase the response size significantly, logging this helps you link slow performance directly to the complexity of the data requested.
Monitoring for performance and errors
The volume and complexity of the data (especially with many endpoints and optional includes) mean you must actively monitor specific metrics:
– Rate limits: Track how close your application is getting to the Sportmonks rate limit (calls per minute/hour). Log every time you receive a 429 (Too Many Requests) error code, as this indicates a serious problem in your refresh strategy.
– Performance regressions: Monitor for sudden spikes in latency or increases in response size. This helps you quickly spot performance issues, whether they are caused by a change on your side or theirs.
Managing an external dependency
Since Sportmonks is an external provider, your monitoring must track this external dependency carefully:
– Dependency tracking: Your monitoring dashboards should include specific alerts for “Sportmonks API Availability” and “Sportmonks API Latency.”
– Troubleshooting: If your user experience is slow, your logs should clearly indicate if the delay was caused by a slow response from the Sportmonks API (external issue) or slow processing time within your own system (internal issue). This helps you maintain reliability for your users by quickly identifying the source of the problem.
Keep your football data API reliable with smart logging and monitoring
Your API is the engine of your football platform and keeping it reliable means logging and monitoring it effectively. The Sportmonks Football API delivers live scores, stats, and odds from over 2,500 leagues, but to get consistent performance, you need to track its health. Log every request, response, and latency to understand how your system interacts with Sportmonks, and monitor rate limits, error rates, and uptime to prevent disruptions.
Start your free trial today and pair Sportmonks’ trusted football data with smart monitoring, so your API stays fast, stable, and ready for match day every time.
Faqs about API logging and monitoring