Contents
Data sources and generation methods
Creating player heat maps in football uses advanced tracking technology and smart data methods. These tools gather detailed info on player movements during a match, making accurate and insightful heat maps possible.
Tracking technologies
- GPS and wearable sensors: Professional football players often wear GPS devices during matches and training sessions. These sensors collect real-time data on movements such as speed, distance covered, and precise positioning. The information is vital for generating heat maps that show the zones where a player spends most of their time on the pitch.
- Optical tracking systems: Camera-based systems like Hawk-Eye and TRACAB are installed in stadiums to track player and ball movements. Using multiple high-speed cameras, these systems provide comprehensive spatial data without requiring players to wear any tracking devices. They are widely used for in-depth performance analysis and tactical evaluation.
- Inertial Measurement Units (IMUs): IMUs include devices like accelerometers and gyroscopes that can be worn by players to supplement GPS tracking. They capture fine-grained data on acceleration, deceleration, and changes in direction, offering a detailed view of player movement dynamics and contributing to more accurate heat maps.
Data processing and visualisation
After collecting raw player tracking data, AI-powered software processes it to map how often and long a player stays in different areas of the pitch. This is then shown as a heat map, using colors to highlight activity levels, warmer colors mean more action, cooler colors mean less. These visual summaries are vital tools for coaches and analysts, helping them make smarter decisions about tactics, player roles, and overall game strategy.
Types of heat maps in football
Football heat maps are flexible tools used to show different aspects of player and team performance. They primarily fall into categories like individual player heat maps, team heat maps, and action-specific heat maps, each offering unique insights.
Individual player heat maps
These heat maps concentrate on the movements and positioning of a single player throughout a match. They are instrumental in assessing:
– Positioning tendencies: Identifying the areas of the pitch where a player spends most of their time, which can indicate their role and adherence to tactical instructions.
– Defensive and offensive involvement: Evaluating how actively a player participates in defensive duties or contributes to attacking plays.
– Work rate: Measuring the ground covered by a player, which can reflect their stamina and commitment.
For instance, a midfielder’s heat map might reveal extensive coverage across the pitch, indicating a box-to-box role, while a striker’s heat map may show concentrated activity in and around the opponent’s penalty area.
Team heat maps
– Tactical formations: Team heat maps help visualise the overall team structure and how it evolves throughout different phases of play, such as attack, defence, and transitions. This aids in assessing formation discipline and responsiveness.
– Possession patterns: By showing areas where the team frequently maintains ball control, heat maps can indicate zones of dominance or potential vulnerability. They are instrumental in evaluating passing networks and ball retention strategies.
– Defensive and offensive zones: These maps reveal how compact or spread out the team is in different scenarios. Coaches can identify whether the team maintains a tight defensive shape or exploits width in attack.
Such heat maps can reveal, for example, if a team consistently builds attacks down a particular flank or if there are gaps in defensive coverage that opponents might exploit.
Action-specific heat maps
These heat maps focus on particular actions or events, such as passes, shots, tackles, or interceptions, providing granular insights into specific aspects of play. They help in:
– Analysing offensive contributions: These maps show where key passes, crosses, or shots are taken, helping to reveal a team’s or player’s attacking tendencies and strategic build-up zones.
– Evaluating defensive efforts: By highlighting areas where tackles, blocks, or interceptions occur, action-specific heat maps expose defensive patterns, strongholds, or vulnerabilities across the pitch.
– Assessing player roles: These visualisations illustrate where individual players are most active in performing specific actions, offering insights into their functional role in various phases of play.
For example, an action-specific heat map might show that a full-back frequently delivers crosses from advanced wide positions, suggesting an attacking role in the team’s setup.
Applications in football analysis
Player heat maps are now vital in modern football, giving us great insights into the game. They’re used for everything from tactical analysis and performance checks to preventing injuries and scouting opponents.
Tactical analysis
Heat maps give coaches and analysts a clear visual of where players move and position themselves. By studying these maps, teams can assess how well their formation works, identify pressing patterns, and evaluate which areas of the pitch they control, helping them refine tactics and player deployment.
For instance, if a heat map shows little activity on the left side of the field, a coach might then change the team’s formation or tell a winger to play more in that area.
Performance evaluation
Individual player heat maps are key for coaches to assess performance and tactical discipline. They can monitor work rate, evaluate positional adherence, and spot areas for improvement like drifting out of position or neglecting defensive duties. For example, a full-back’s heat map showing too much attacking movement and too little defensive coverage would highlight a need to balance their responsibilities.
Injury prevention and fitness analysis
Heat maps, along with GPS and tracking data, are crucial for monitoring player workload and preventing injuries in football. By analysing movement patterns and intensity, medical and coaching staff can detect overexertion, allowing for necessary rest or rotation. They can also tailor training programs and identify injury risks (like overuse) to implement proactive prevention measures, ensuring players’ well-being.
Opposition scouting
Analysing opponent heat maps helps teams uncover strategic tendencies and weaknesses. Scouts and analysts can identify key threats, exploit vulnerabilities like underutilised zones, and prepare tactical responses to counteract strengths and target weaknesses, for instance, by attacking exposed flanks.
Limitations of heat maps
While player heat maps are useful in football analysis, they have limitations. Understanding these is crucial to avoid misinterpretations and ensure accurate decisions.
Lack of contextual information
Heat maps show where a player has been active on the pitch but do not reveal the quality or result of actions in those areas. A heavily marked zone might involve successful dribbles or repeated turnovers, yet the heat map alone offers no distinction. Without complementary data such as match events or decision-making context, interpretations can be misleading.
Overemphasis on possession-based data
Traditional heat maps tend to focus on ball-related activity, potentially neglecting crucial off-the-ball contributions. Movements like pressing, decoy runs, or strategic positioning are vital aspects of play that often go unrepresented. This bias may undervalue players whose impact lies in their off-the-ball intelligence and tactical discipline.
Misinterpretation of activity levels
A dense heat zone doesn’t always signal effective performance. For example, a defender might appear highly active in an area simply because they were being constantly targeted and beaten, indicating a defensive vulnerability. Similarly, a striker with minimal heat map activity might have had a major impact through efficient positioning or a game-winning goal with limited touches.
Variability due to data collection methods
The accuracy of a heat map is influenced by the type of data used. Event-based data (such as pass or tackle locations) captures only selected moments, while tracking data (like GPS or optical systems) provides continuous positional information. These differences can lead to inconsistent or incomplete representations of a player’s movements and positioning.
Influence of match context
Heat maps don’t reflect the tactical nuances of a match, such as changes in formation, scoreline pressure, or role adjustments. A player’s map in a defensively compact team will differ dramatically from one in a possession-heavy setup. Without understanding these dynamics, analysts risk drawing inaccurate conclusions from the visual data.
Visual representation challenges
The design of heat maps plays a significant role in how data is perceived. Colour gradients, such as rainbow maps, might not be uniform in their readability and can be difficult for individuals with colour vision deficiencies. Selecting clear, accessible colour schemes is essential to ensure accurate and inclusive visual interpretation.
Tools for creating heat maps
Player heat map creation in football has been transformed by tech advancements. Various tools, from pro software to open-source libraries, now let analysts and coaches easily visualise player movements and activity.
Professional software solutions
Catapult Sports (OpenField)
Catapult’s OpenField platform enables the creation of heat maps using GPS data from wearable devices. These visualisations show where players spend the most time on the pitch, supporting both performance analysis and tactical strategy.
PlayerData
PlayerData provides tools that generate heat maps based on player movement data. These maps highlight zones of high and low activity, helping coaches assess positioning, workload, and spatial tendencies during play.
GAMEFACE.AI
This platform delivers dynamic heat maps by processing match footage. It offers insights into player positioning and movement trends, enhancing the depth of tactical evaluations.
Wyscout
Wyscout is a widely used analytics platform that includes video analysis and data visualisation tools such as heat maps. It supports scouting, match analysis, and performance assessments at professional levels.
Nacsport
Nacsport offers video analysis software with capabilities for generating heat maps to evaluate player performance and team tactics. It is commonly adopted by professional clubs for comprehensive match analysis.
Open-source libraries and tools
For creating football heat maps, you have several open-source options. Python users can leverage mplsoccer for specialised football visualisations and Seaborn for general statistical data representation. If you prefer R, the ggsoccer library extends ggplot2 to plot pitch diagrams with event data overlays. For those without programming skills, Excel and Google Sheets offer a simpler alternative, allowing you to manually input data and use conditional formatting to visualise player activity.
Online heat map generators
For creating football heat maps without coding, several online platforms are available. Displayr allows you to upload datasets and offers customisation for visual representation. TabLab provides intuitive tools for generating various graphs, including heat maps, for quick visualisations. Additionally, We Do Data Science offers a free online heat map maker where you can input data to create visual representations easily.
Future trends in player heat maps
As football continues to embrace technological advancements, player heat maps are evolving beyond static representations of past movements. Emerging trends indicate a shift towards more dynamic, predictive, and immersive tools that enhance tactical analysis, player development, and fan engagement.
Predictive analytics and AI integration
AI and machine learning are changing football heat maps from just showing past activity to predicting future movements. By analysing huge amounts of data, AI can forecast player positions and suggest real-time tactical changes, helping coaches anticipate opponent strategies during games.
Real-time data visualisation
New tracking and data tech now lets us create heat maps in real-time. This means coaches can see player movements as they happen, allowing for instant tactical feedback and adjustments, and greatly improving live strategy and performance assessment.
Enhanced visualisation techniques
The future of heat maps will bring advanced visuals like 3D and augmented reality, offering a much deeper look into player movement and team tactics. These immersive views will greatly benefit both coaches and fans.
Personalised training and injury prevention
By combining heat maps with biometric data, we can create personalised training plans for players. This helps coaches optimise performance and lower injury risks by matching training to individual needs and movement patterns.
Democratisation of advanced analytics
Advanced football analytics are no longer just for top-tier clubs. Thanks to open-source software and more affordable tracking technologies, even lower-tier teams and grassroots organisations can now access powerful tools like heat maps. This expansion of access helps a much wider range of teams use data for performance analysis and tactical planning, leading to a more competitive and data-informed football environment overall.
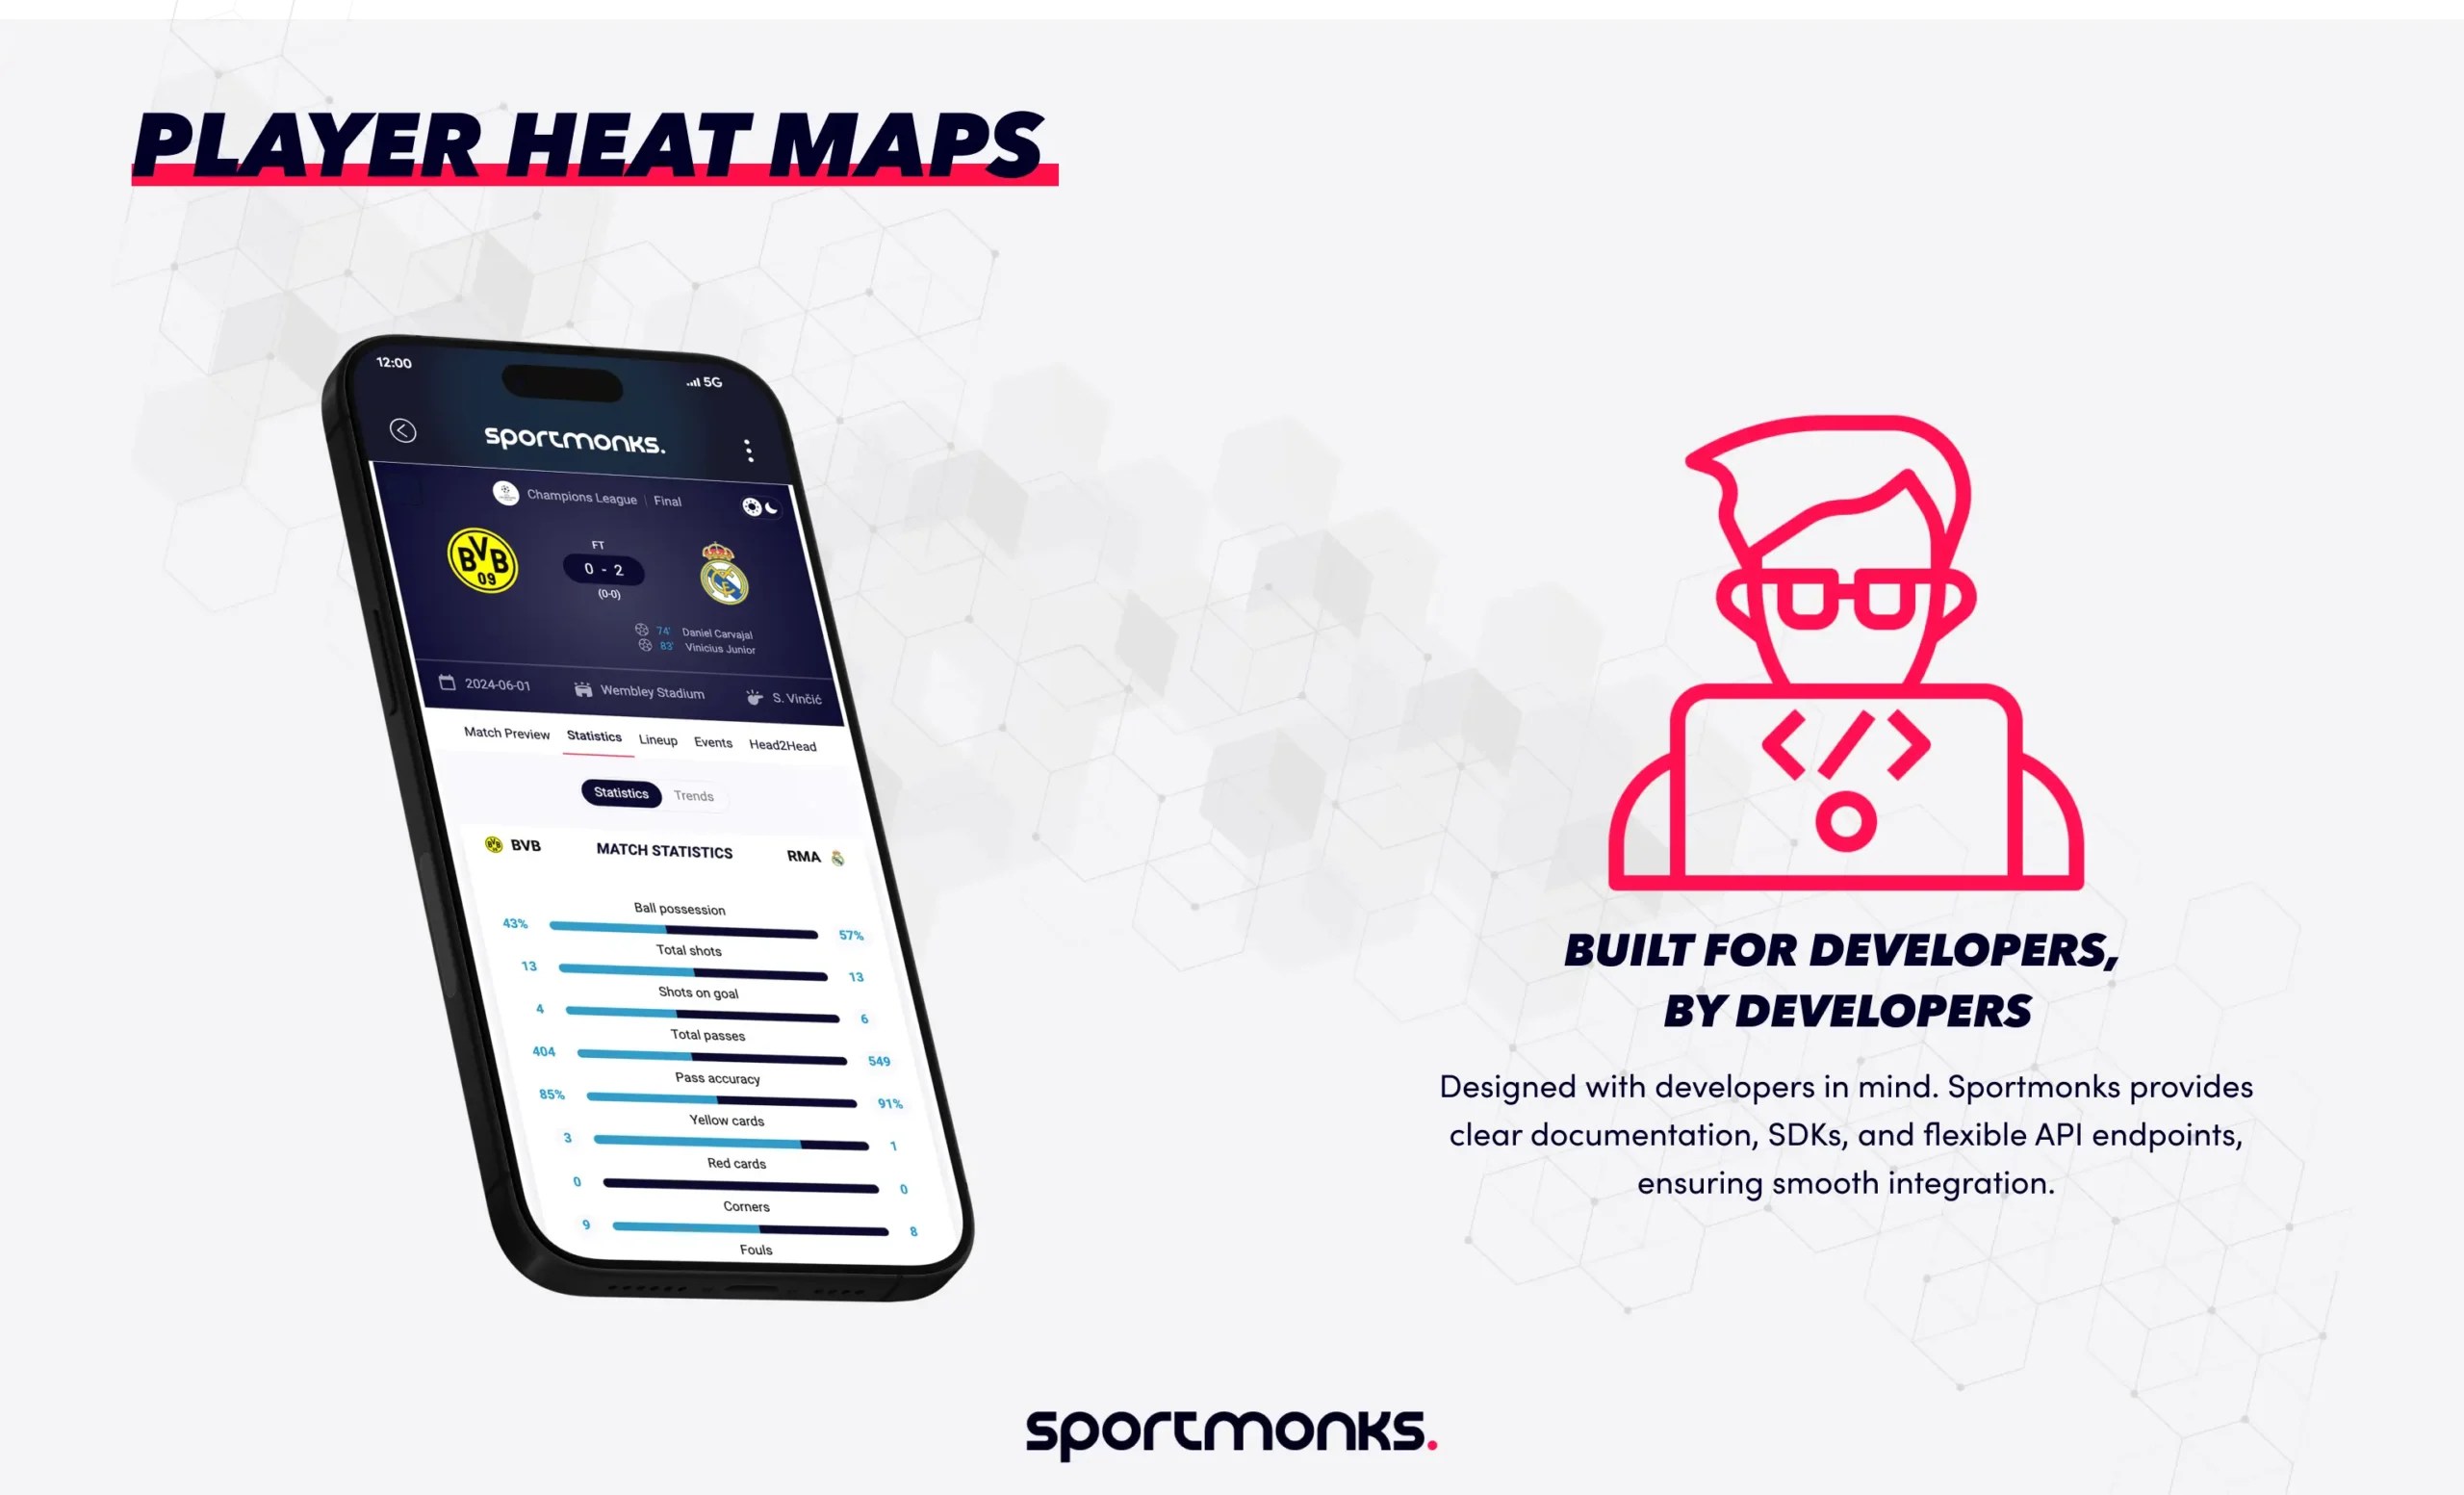
Sportmonks and heat map-related technologies
While Sportmonks does not provide pre-generated heat maps, it offers a comprehensive suite of football data through its football API, enabling developers and analysts to create detailed heat maps and other visualisations.
Leveraging Sportmonks data for heat maps
Sportmonks’ football API delivers extensive data, including:
– Player statistics: Detailed metrics such as goals, assists, passes, tackles, and more.
– Match events: Information on events like goals, substitutions, and cards, which can be timestamped and associated with specific players.
– Ball coordinates: Data on the ball’s position throughout the match, useful for analysing possession and movement patterns.
By integrating these data points, developers can map player movements and activities across the pitch, forming the basis for heat map generation.
Creating heat maps using Sportmonks data
To generate heat maps:
- Data collection: Use our API to gather player-specific data, including positions and events.
- Data processing: Organise the data to track player locations over time.
- Visualisation: Employ visualisation tools or libraries (e.g., Python’s Matplotlib or Seaborn) to create heat maps that illustrate player activity intensity across different pitch areas.
This approach allows for customised heat maps tailored to specific analytical needs.
Applications and benefits
Utilising Sportmonks data for heat map creation offers several advantages:
– Tactical analysis: Understand player positioning and movement patterns to inform strategic decisions.
– Performance evaluation: Assess individual player contributions and adherence to tactical roles.
– Fan engagement: Enhance fan experiences by providing in-depth visual analyses of player performances.
By leveraging Sportmonks’ robust data offerings, analysts and developers can create insightful heat maps that contribute to a deeper understanding of football dynamics.
Build smarter player heat maps with Sportmonks data
Player heat maps bring football tactics to life, but the insights are only as good as the data behind them. With Sportmonks’ football API, you get access to rich player stats, event coordinates, and real-time match data that power precise, customised heat map visualisations.
Start using Sportmonks today to turn raw match data into powerful visuals that drive better analysis, coaching, and fan engagement.
Faqs about heat maps
- Data collection: Gather positional data using GPS trackers, wearable sensors, or optical tracking systems.
- Data processing: Process the collected data to map player movements and positions on the pitch.
- Visualisation: Use visualisation tools like Python's mplsoccer, Seaborn, or software like Power BI and Excel to create the heat map.