Contents
Definition
Expected Assists (xA) quantifies the probability that a completed pass will become a goal assist. It is expressed as a decimal value between 0 and 1, where values closer to 0 indicate a very low probability of leading to an assist, while values closer to 1 represent a high probability. However, no pass is ever guaranteed to result in a goal, so a true value of 1 does not exist in practice.
xA considers multiple factors, including the type, length, and location of the pass, as well as the positioning of teammates and defenders. Importantly, it isolates the creator’s contribution from the finishing ability of the receiver. This allows analysts to assess a player’s playmaking skills more accurately, regardless of how well their teammates convert chances.
xA is closely linked to Expected Goals (xG), which measures the quality of a shot attempt. When a player like Martin Ødegaard threads a perfectly weighted through ball, splitting the defense and putting Kai Havertz one-on-one with the goalkeeper, the pass itself carries an xA value. Simultaneously, the shot Havertz takes—whether he scores or misses—has an associated xG value.
If Havertz converts the chance, his xG and Ødegaard’s xA are both reflected positively in the stats. However, if he misses, Ødegaard still gets credit for creating a high-quality opportunity through xA, even though no assist is recorded. This distinction helps analyze players more accurately, especially when evaluating those whose teammates may overperform (scoring difficult chances) or underperform (missing high xG chances).
By considering both xA and xG together, analysts, coaches, and fans can better assess a player’s creative impact and how efficiently their team capitalizes on opportunities.
Why is xA important?
xA offers several key advantages for football analysis:
👉 More accurate player evaluation: Traditional assist counts can be misleading. A player might have few assists due to poor finishing by their teammates, or they might have a high number of assists due to fortunate deflections or tap-ins. xA provides a more objective assessment of a player’s ability to create scoring chances.In the 2016-17 La liga season, Messi at Barcelona created numerous high-quality chances with an xA of over 12 points but only registered 9 assists (StatsMuse), indicating that he was creating far more scoring opportunities than his assist count suggested.
👉 Deeper attacking analysis: By analyzing xA for individual players and teams, analysts can gain insights into the effectiveness of different attacking strategies. It helps identify which players are most effective at creating high-quality chances, which areas of the pitch are most productive and the vulnerabilities of the opposing team. A team might have a high overall xA but struggle to score goals. This could indicate that they are creating many chances from low-probability areas or that their finishing is inefficient.
👉 Informed recruitment and scouting: xA can be a valuable tool for identifying potential transfer targets. A player with a high xA but a low assist count might be undervalued by other teams, presenting a good opportunity for recruitment. Imagine a scout is looking for a creative midfielder. Player A has 10 assists, while Player B has only 5. However, upon closer inspection, Player B has a significantly higher xA. This suggests that Player B is creating more and better chances, and their lower assist count might be due to playing in a less efficient attack.
👉 Predictive power: Research suggests that xA can be a more stable predictor of future assist performance than actual assists, as it’s less affected by the randomness of finishing. If a player has a sudden spike in assists due to a short period of clinical (unmaintainable) finishing by their teammates, their xA might not show a corresponding spike. This indicates that their underlying creative ability hasn’t necessarily changed, and their assist numbers are likely to regress to the mean in the future.
How is xA measured?
xA, or Expected Assists, is a way to measure how good a player is at creating scoring chances for their teammates. It’s like xG, but for passes instead of shots.
Imagine this: a player makes a killer pass that puts their teammate in a perfect position to score. Even if the shot is missed, that pass was still incredibly valuable, right? xA helps us recognize those moments of brilliance.
xA gives each pass a number, usually between 0 and 1, that shows how likely it is to lead to a goal. A pass with an xA of 0.8 is a really dangerous pass that’s very likely to set up a goal, while a pass with an xA of 0.1 is less likely to create a scoring chance.
But how do they calculate this number? They look at a few things:
👉 What kind of pass was it? A through ball that splits the defense is more likely to lead to a goal than a simple pass to the side. Crosses into the box and cutbacks to the edge of the area are also usually high xA passes.
👉 Where did the pass start and end? Passes closer to the opponent’s goal, especially those into the penalty area, have a higher xA. Passes aimed right at the danger zones in front of goal are even more likely to create a scoring chance.
👉 How was the pass made? A long, accurate pass to a winger running free might have a higher xA than a short pass in midfield, even if both passes are completed.
👉 Was there pressure from defenders? A pass made under pressure or into a crowded area is less likely to lead to a goal than a pass to a player in open space.
👉 What was happening in the game? Some fancy xA models even consider the score, the time left in the game, and whether the team is playing at home or away.
It is important to note that different data providers (such as FootyStats, Sportmonks, and Fbref) may use slightly different algorithms and data sources, leading to some variation in xA values.
How to interpret xA
xA tells you how likely a pass is to lead to a goal. But there are a few things to keep in mind when looking at xA numbers:
It’s about chances, not guarantees
xA is all about probability. A pass with an xA of 0.3 doesn’t mean it will become an assist, just that similar passes have led to assists about 30% of the time. Football is full of surprises.
Context matters
You can’t just compare xA numbers without thinking about the bigger picture. Here’s why:
👉 Different leagues, different styles: Some leagues are more defensive, others are more attacking. A high xA in a defensive league might be even more impressive than a high xA in an attacking league, where creating chances is easier. Also, teams that play different styles (long balls vs. short passes) will have different xA patterns.
👉 Position on the field: A striker will have different chances to create assists than a midfielder. It wouldn’t make sense to compare their xA directly.
👉 Team tactics: Teams that like to keep possession usually create more chances than teams that play on the counter-attack. This can affect the xA of their players.
xA works best with other stats
To really understand a player’s performance, you need to look at xA along with other stats like:
👉 Key passes: These are passes that lead to a shot, whether the shot goes in or not.
👉 Shot-creating actions: These include any action that leads to a shot, like passes, dribbles, or winning a foul.
👉 Actual assists: Comparing xA to actual assists can tell you if a player is unlucky (creating great chances that their teammates miss) or if their teammates are clinical finishers.
What does high or low xA mean?
👉 High xA (above 0.3 per 90 minutes): This usually means a player is creating lots of great chances for their teammates. Think of Kevin De Bruyne – he’s always setting up goals.
👉 Low xA (below 0.1 per 90 minutes): This might mean a player isn’t involved in creating many chances, but it depends on their position and role. A defensive midfielder might have a low xA but still be doing a great job.
xA in action
Bruno Fernandes had a high xA a few seasons ago, showing how creative he was for Manchester United. Kieran Trippier had a high xA despite being a right-back, mostly from crosses and set pieces.
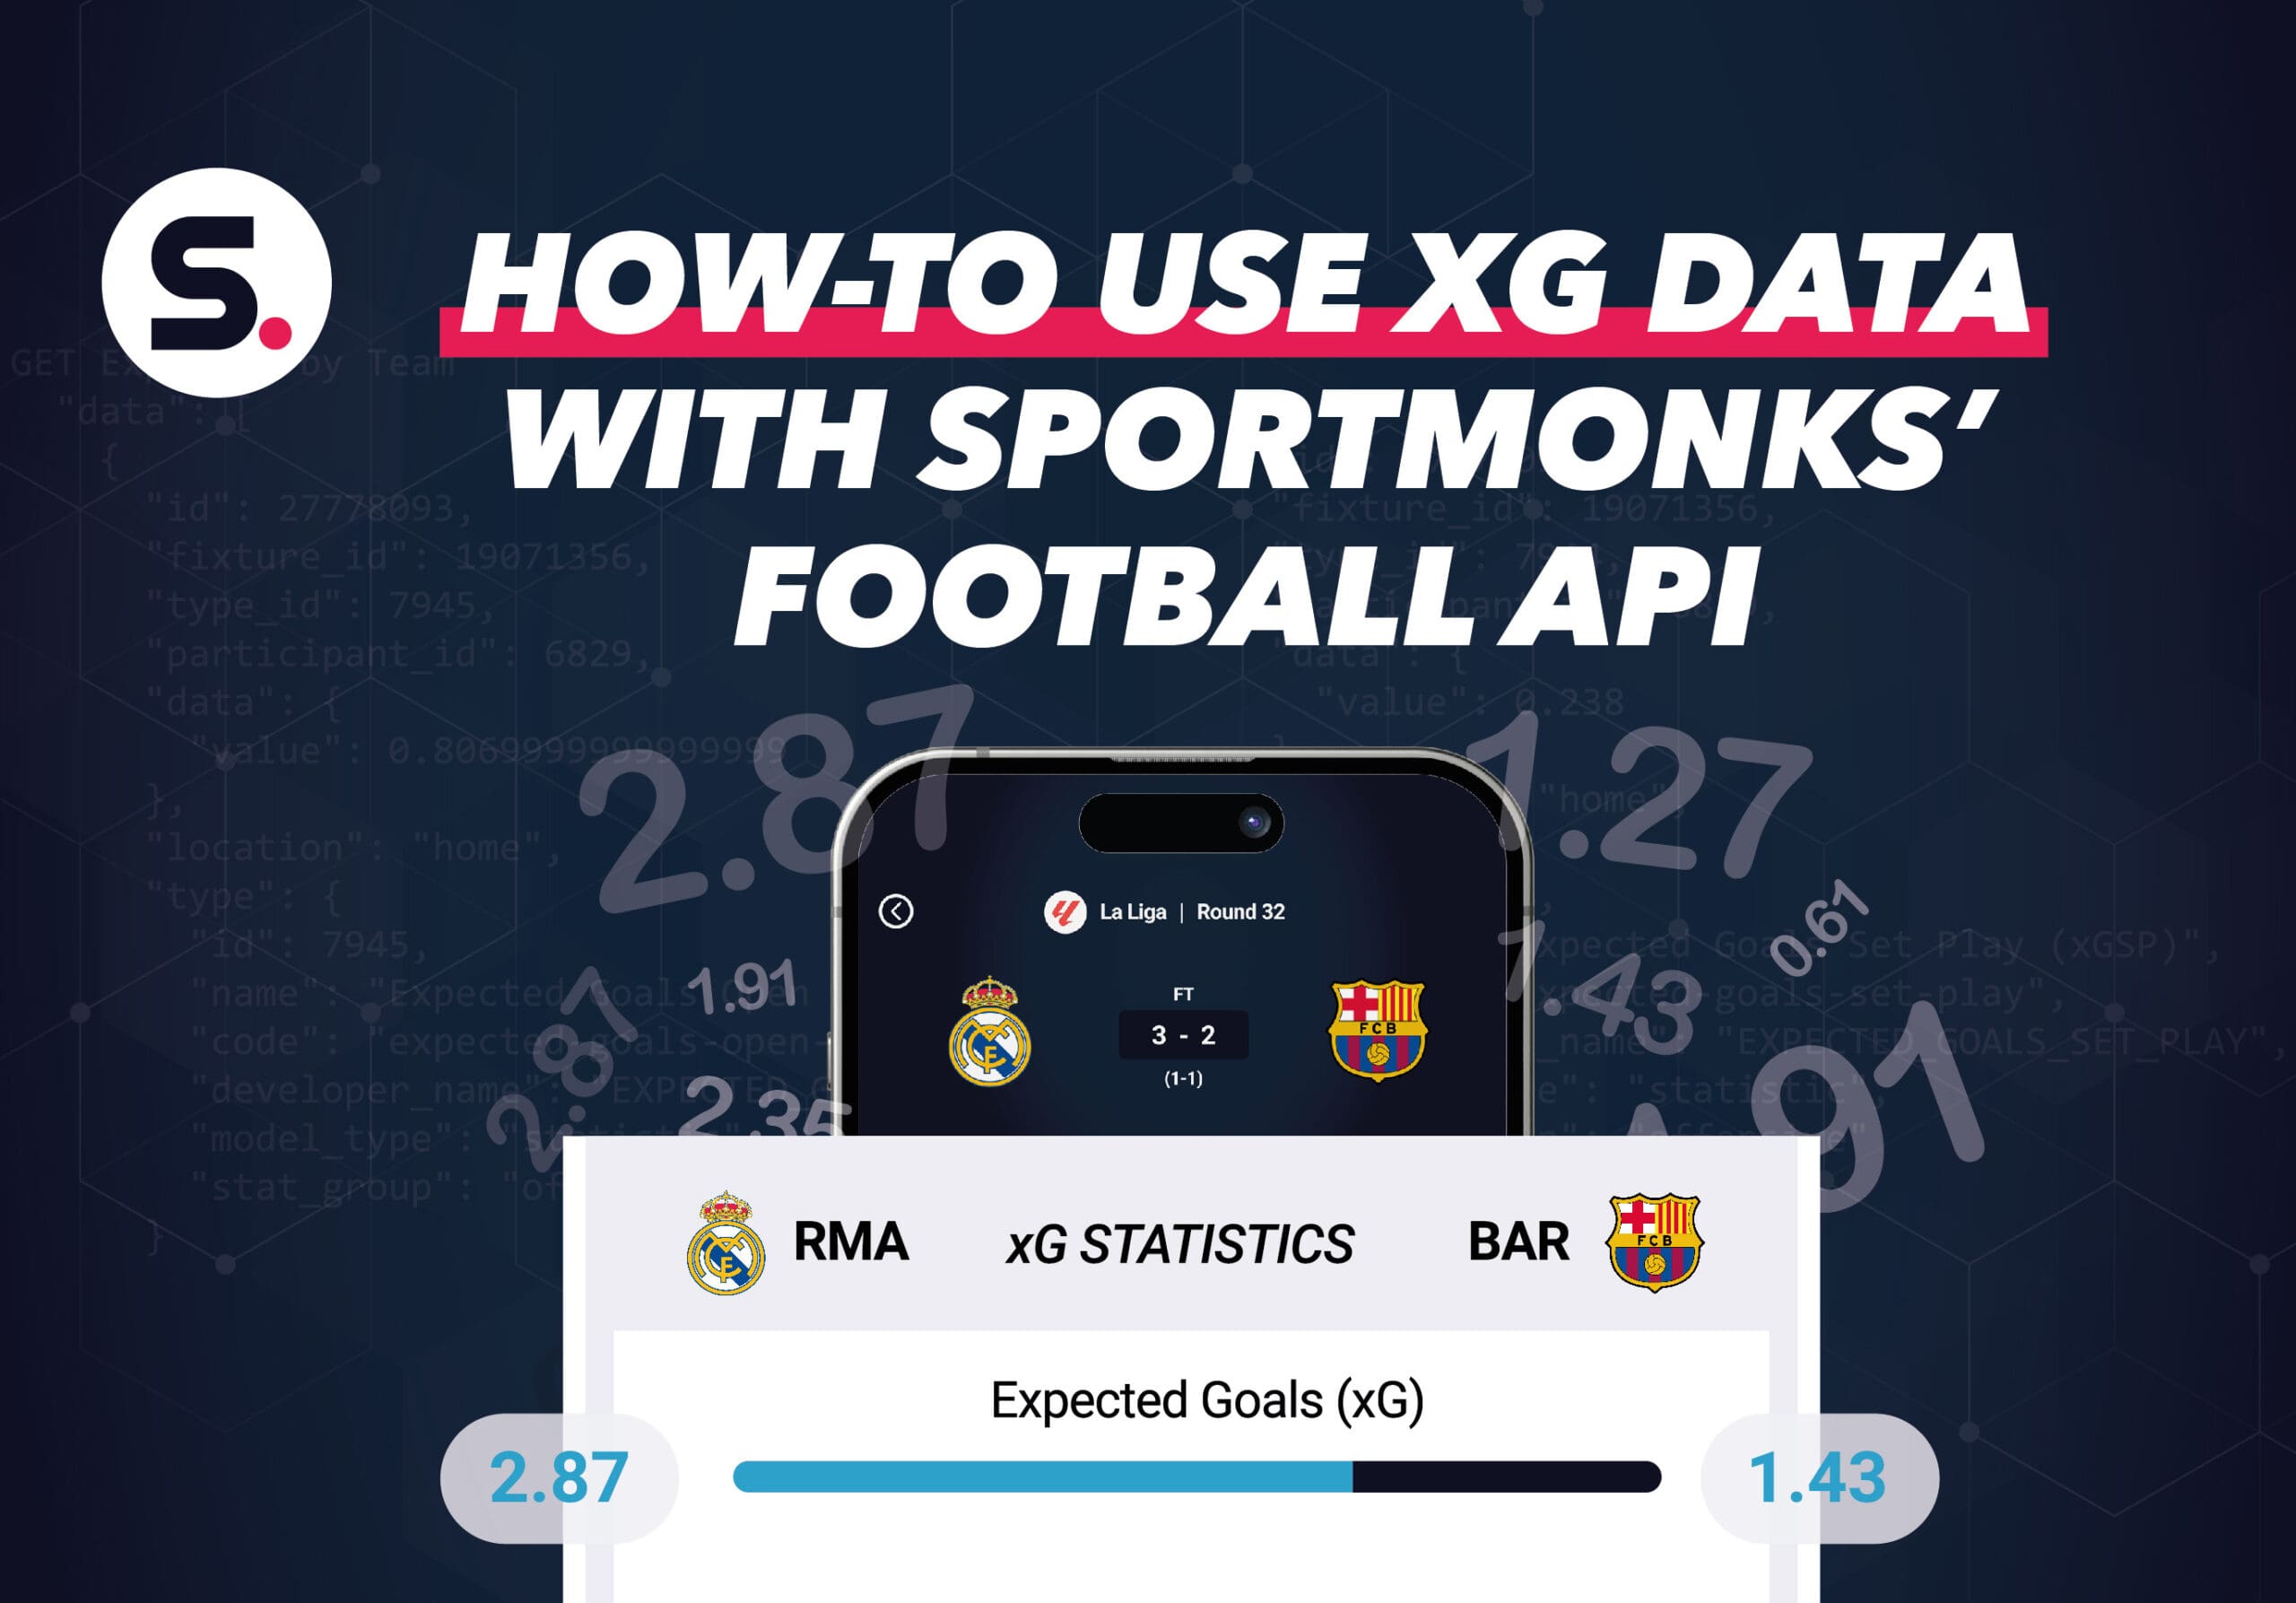
Ready to dive deeper into football analytics? With Sportmonks’ Football API, you can access comprehensive data, including, xG, and more for over 2,200 leagues. Start your 14-day free trial today.
Common challenges and considerations
While xA is a really useful tool, it’s important to understand that it’s not perfect. Here are some things to remember:
How the models work (and where they can fall short)
xA models use past data and probabilities to try and predict how likely a pass is to lead to an assist. They do a good job of looking at the most important things, but they can’t capture everything that happens in a real football match. Things like a moment of brilliance from a player, a silly mistake by a defender, or a player suddenly playing much better or worse than usual can affect what happens in ways that xA might not fully predict.
Different ways of measuring xA
Like we talked about before, different companies that collect football data use slightly different ways of calculating xA. This means that you might see different xA numbers for the same pass depending on where you get the data from. So, it’s important to stick to using data from the same source if you’re comparing players or teams. If you mix data from different places, you might get confused.
Context matters (especially with small samples)
Things like a team’s tactics, how they like to play, and how good the other team is can all affect xA. Also, if you’re looking at a player who hasn’t played many games, their xA numbers might not be very reliable. It’s important to keep these things in mind and not jump to conclusions based on just a few games or isolated stats.
Don’t rely on xA alone
xA is best used along with other stats, like key passes (passes that lead to shots), how often a player helps create shots, passes into the final third of the pitch, and even how well they defend. Looking at all these things together gives you a much better picture of how a player is performing. If you only look at xA, you might get the wrong idea. For example, a player with a high xA might not be a good fit for a team that plays long balls and counter-attacks quickly.
What xA doesn’t show (Off-the-ball movement)
xA mainly looks at what happens with the pass itself. It doesn’t really take into account how players move without the ball to create space and make those passes possible. A player might make a great run or position themselves cleverly to make a pass more likely to succeed, but xA doesn’t always fully show this.
xA: The fine print
xA is a really helpful stat, but it’s not a magic crystal ball. Here are some things to keep in mind:
👉 xA can’t predict everything: xA is based on what’s happened in tons of past games, but football is full of surprises. Sometimes a player makes an amazing pass that nobody saw coming, or a defender makes a silly mistake. xA doesn’t always capture those unexpected moments.
👉 The bigger picture matters: xA can be affected by things like team tactics, the quality of the other team, and even just random luck. Also, if you’re only looking at a few games, the xA numbers might not be very reliable.
👉 xA is just one piece of the puzzle: Don’t rely on xA alone. It’s most useful when you look at it alongside other stats, like key passes, shots created, and even defensive contributions. A player with a high xA might not be the right fit for every team, especially if they’re not good at other things.
👉 xA doesn’t see everything: xA focuses on the pass itself, but it doesn’t really consider how players move without the ball. Sometimes a player makes a clever run that creates space for a pass, and that’s really important, even if xA doesn’t fully capture it.