
Contents
Expected Goals is the metric that turned "they should have scored" from a pub argument into a number. It is now standard in broadcasts, recruitment, betting models, and fantasy tools. This guide covers three things in one place: what xG actually measures, what every xG metric in the family means, and exactly how to pull xG data from the Sportmonks Football API, with real responses.
If you just want to start building, jump to how to get xG data from the API.

What Expected Goals is
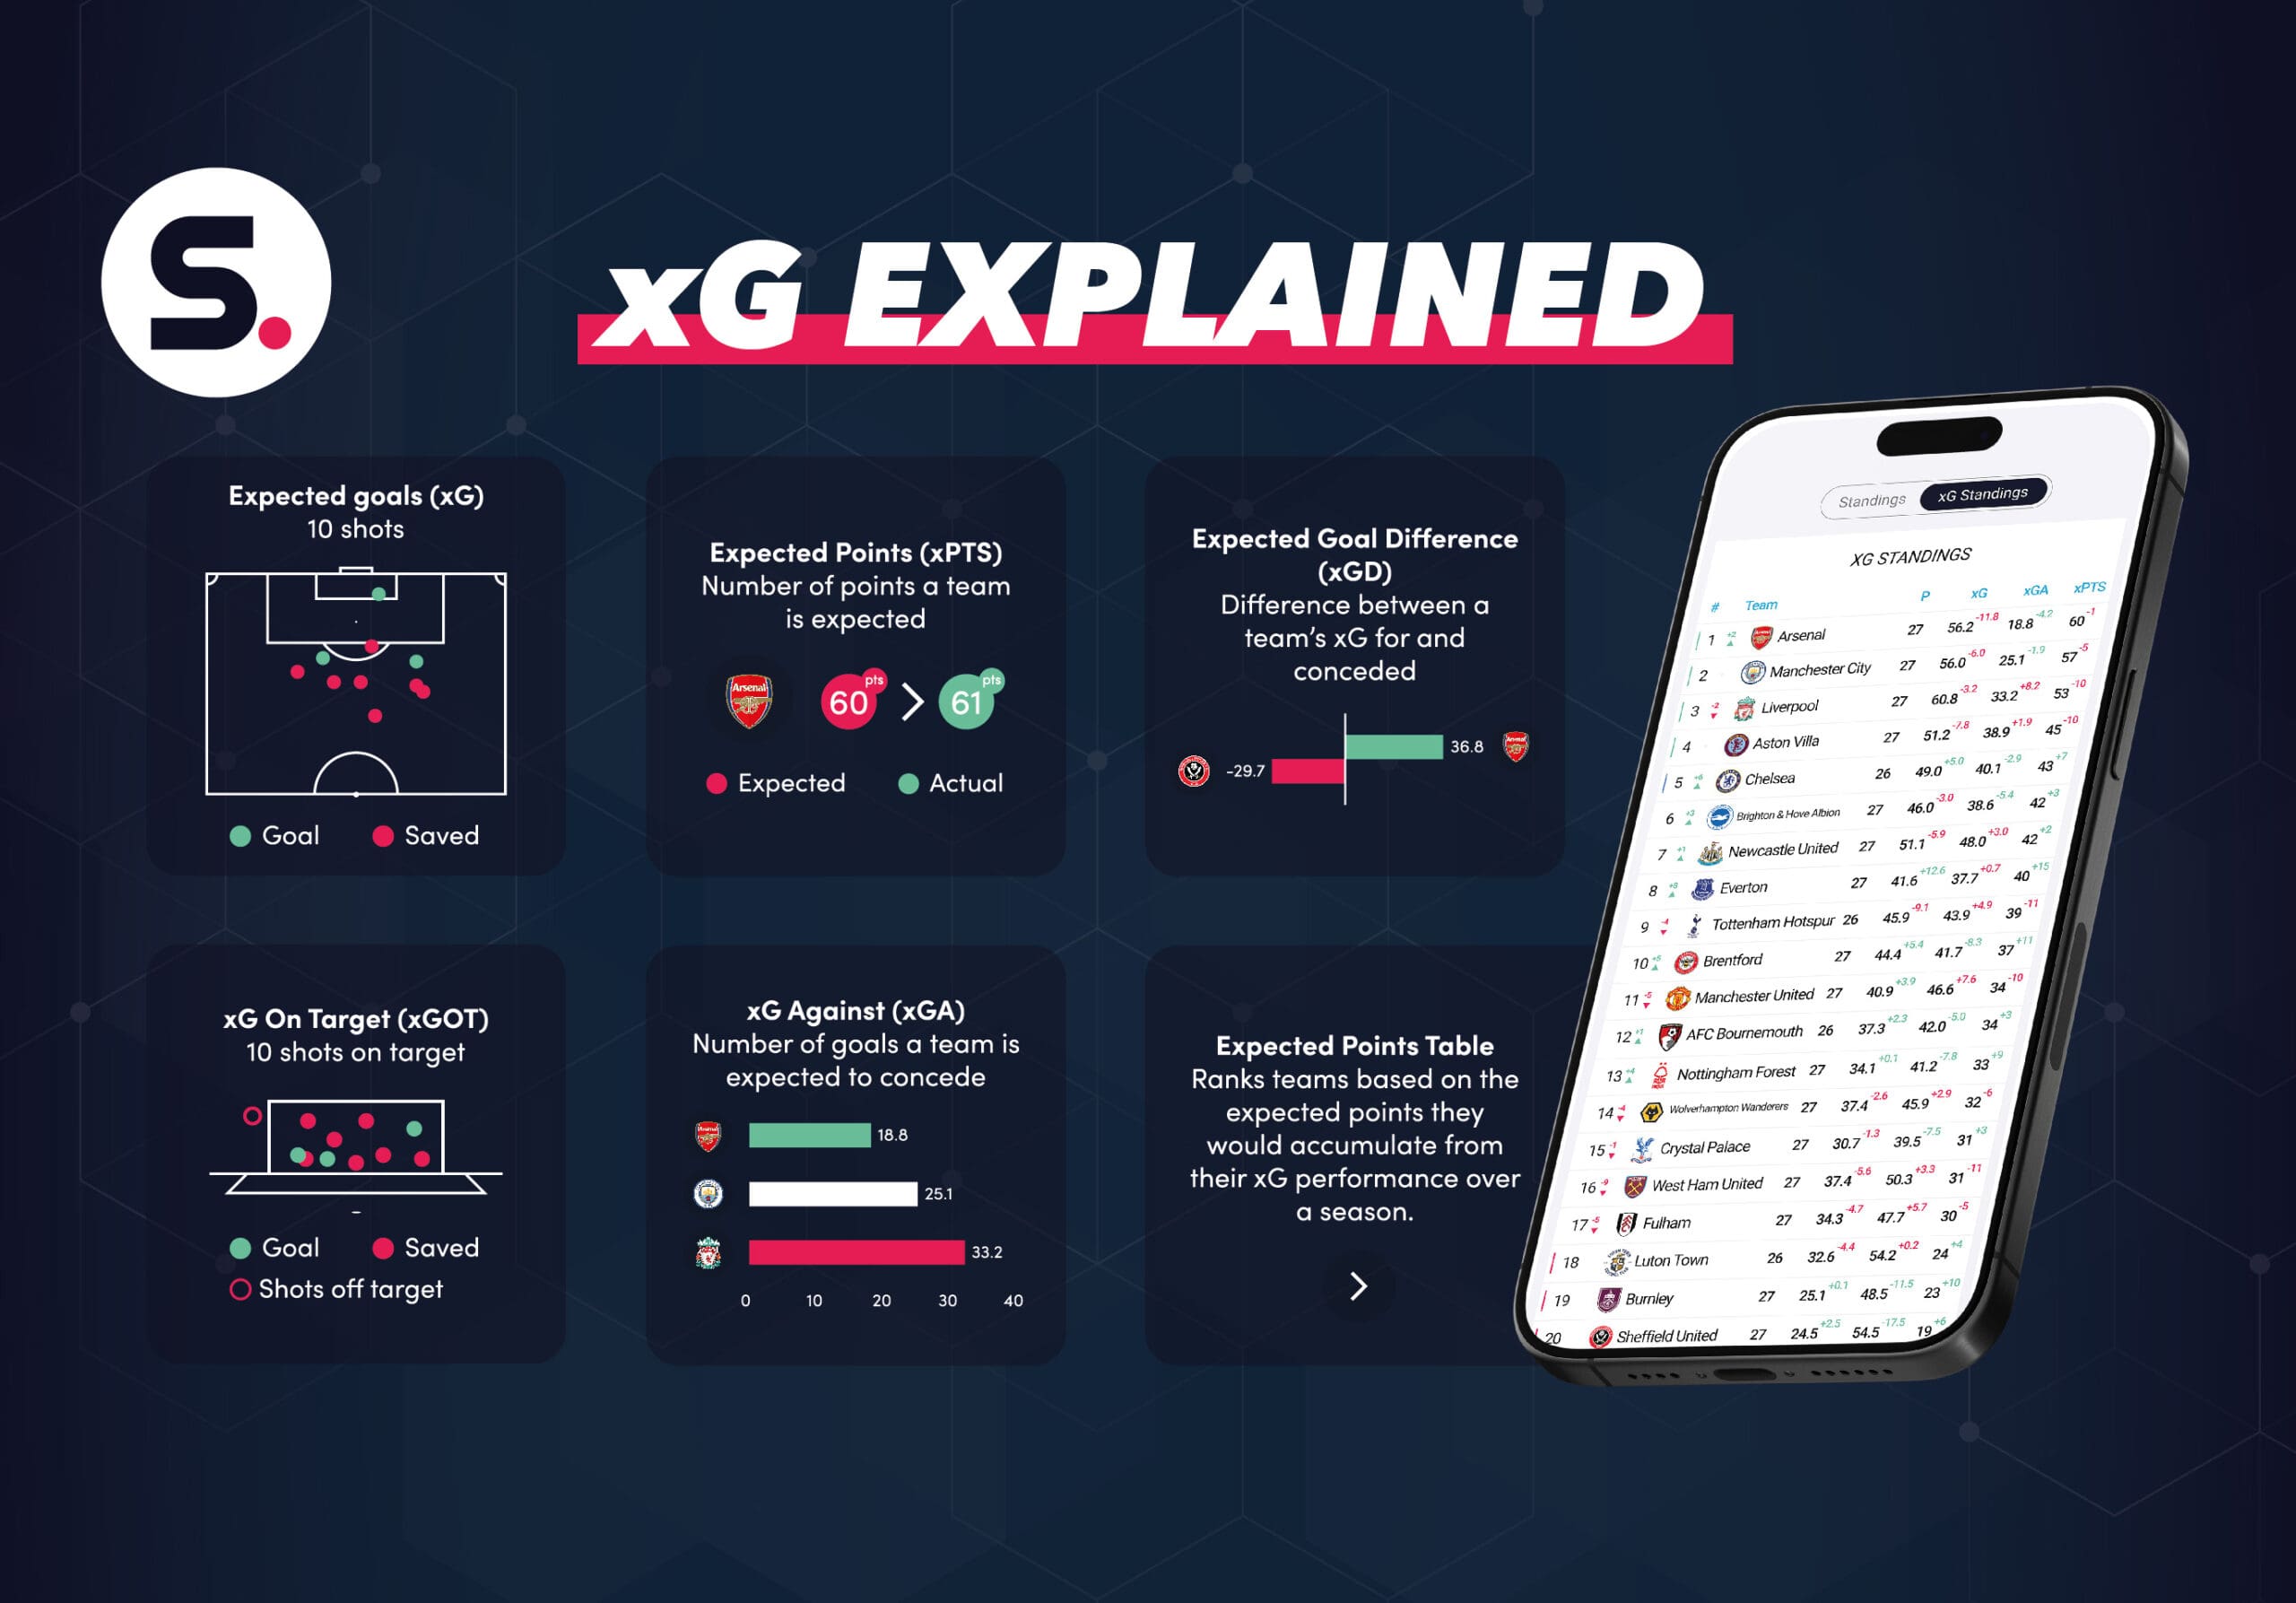
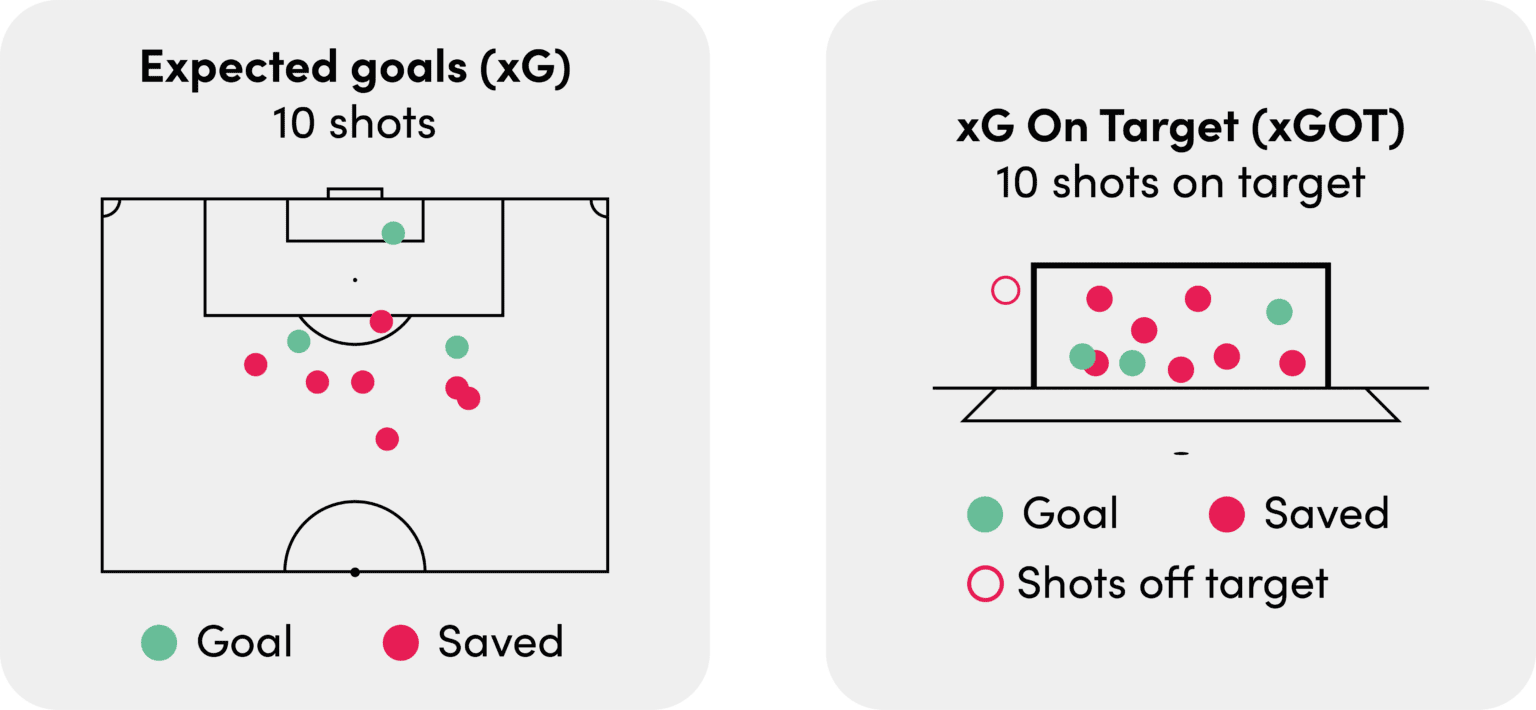
Expected Goals (xG) quantifies the quality of a goal-scoring chance. Every shot gets a value between 0 and 1 that represents the probability of that chance being scored, based on what the model knows about it. A chance with 0.20 xG should be scored about 20% of the time. A chance with 0.99 xG should be scored about 99% of the time, and even then there is a 1% chance it stays out.
As the Bundesliga's data partner Sportec Solutions puts it:
"An xG model computes for each chance the probability to score based on what we know about it. The higher the xG, with 1 being the maximum as all probabilities range between 0 and 1, the higher the probability of scoring. If a chance has 0.2 xG, it should be scored 20 per cent of the time." Sportec Solutions, the Bundesliga's official data partner
How xG is calculated
An xG model looks at each chance and weighs the factors that historically decide whether that type of chance is scored:
- Shot location, angle, and distance from goal
- The type of pass that created the chance (a through ball tends to produce a better chance than a cross)
- Number of defenders between the ball and the goal
- Body part used (a foot shot converts more often than a header)
- Position of the goalkeeper
- Other situational variables
A tap-in from the six-yard box might carry 0.90 xG. A speculative shot from 30 yards might carry 0.05.
What the model deliberately does not include is who takes the shot. xG scores the chance, not the player. It does not matter if Lionel Messi is standing over the ball or one of our data scientists is: the same chance gets the same xG. That is the point. It lets you separate the quality of chances created from the finishing skill applied to them.
How to read an xG number
A few reference points make xG readable at a glance:
- A single shot sits between 0 and 1.
- Around 0.38 and above is considered a big chance.
- A penalty is worth about 0.79 xG on average, taken from 11 metres.
- A player's total in a match usually lands between 0 and 1.5.
- A team's match total is typically 0 to 2 or 3. A team total above 5 is rare and usually means a heavy mismatch.
The most valuable use of xG is comparing it to actual goals over time:
- Scored more than xG (overperformance): clinical finishing, or a hot streak that often regresses toward xG over a season.
- Scored fewer than xG (underperformance): wasteful finishing, or bad luck that often corrects.
Read it with context. A team that scores early and then sits deep will concede lots of low-quality shots, inflating the opponent's shot count without inflating their chance quality. This is why a shot map tells a better story than a shot count: five shots from close range can be "worth" more than ten from distance. Just remember the caveat from earlier: a higher xG suggests a team created the better chances, not that they deserved to win that specific match.
The xG metric family
Sportmonks does not stop at a single xG number. The API exposes the full family of expected metrics, each with a stable type_id you can filter on. Here is what each one means and its identifier in the API.
| Metric | Abbr | type_id | What it measures |
|---|---|---|---|
| Expected Goals | xG | 5304 | Chance quality of a shot, pre-shot (0 to 1) |
| Expected Goals on Target | xGoT | 5305 | Post-shot quality of on-target shots: how likely the shot, as struck, is to be scored |
| Non-Penalty xG | npxG | 7943 | xG with penalties removed (corners and free kicks still included) |
| Expected Goals Open Play | xGOP | 7945 | xG from open play only, all set pieces removed |
| Expected Goals Set Play | xGSP | 7944 | xG from corners, free kicks, and penalties combined |
| Expected Goals Corners | xGC | 7942 | Set-piece xG from corners |
| Expected Goals Free Kicks | xGFK | 7941 | Set-piece xG from free kicks |
| Expected Goals Penalties | xGP | 7940 | Set-piece xG from penalties |
| Shooting Performance | SP | 9685 | xGoT minus xG: shot execution quality above or below chance quality |
| Expected Goals Prevented | xGP | 9686 | Goalkeeper metric: goals prevented versus expected from shots faced |
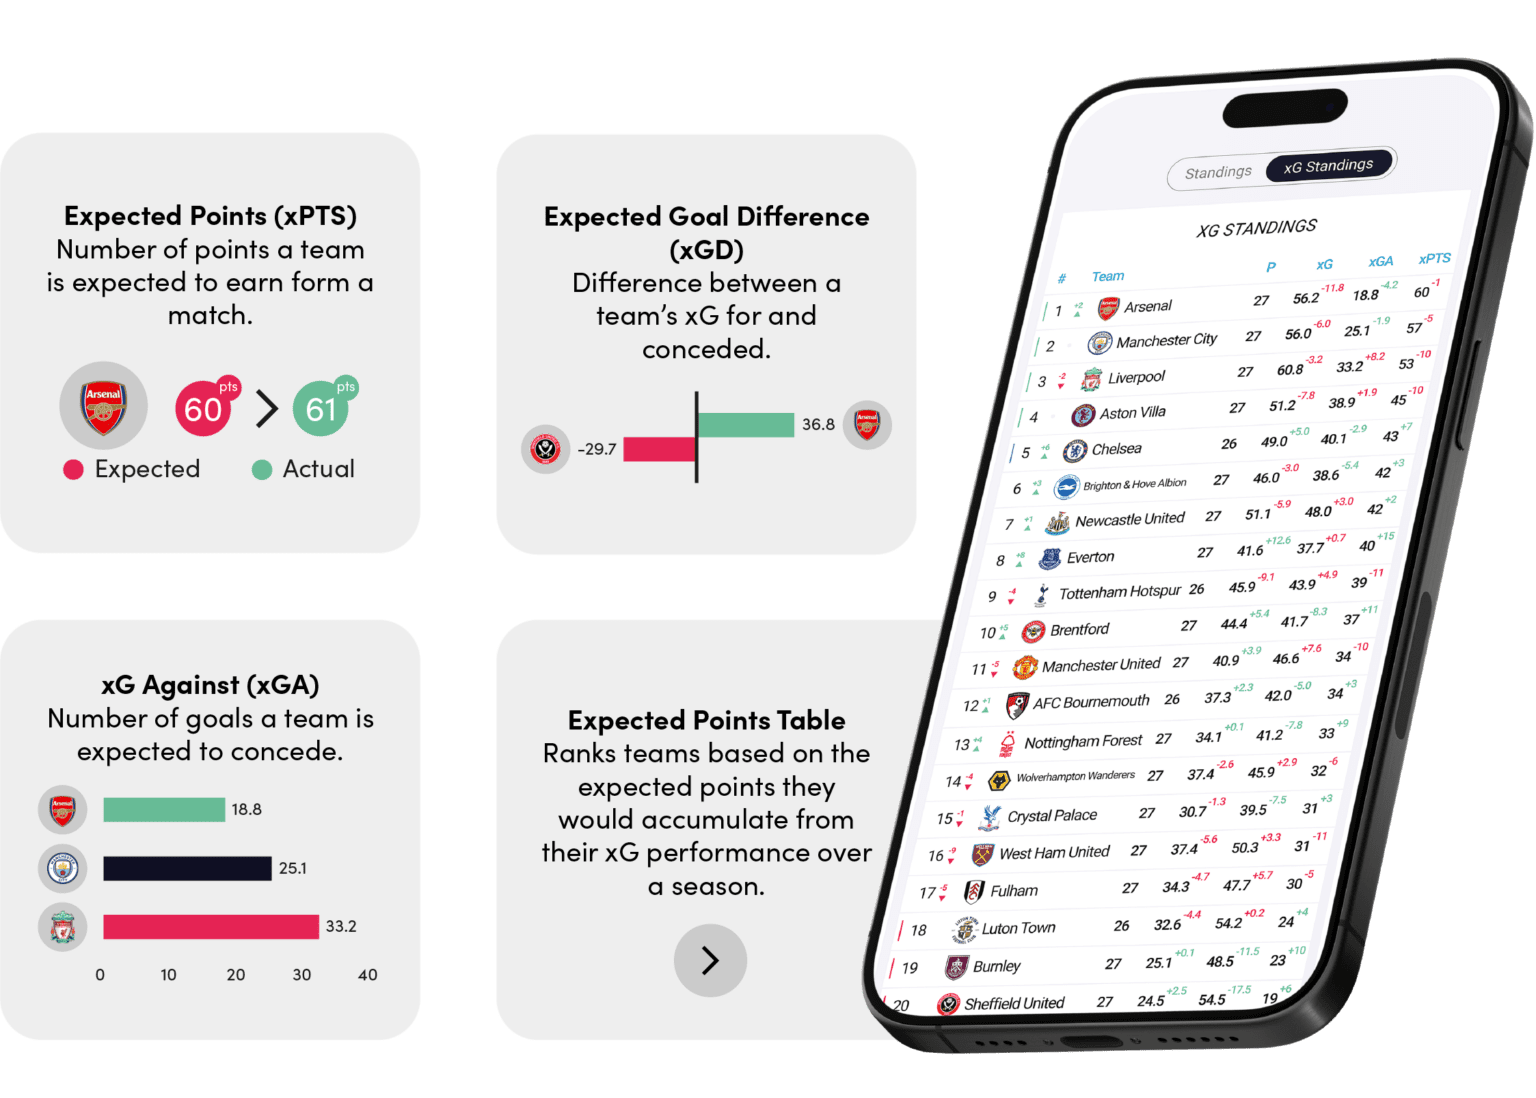
| Expected Points | xPTS | 7939 | Points a team should have earned given its xG for and against |
| Expected Goals Against | xGA | 9687 | Expected goals conceded |
| Expected Goals Difference | xGD | 9684 | xG for minus xG against |
Two of these are worth a closer look because they are the most misread.
xGoT versus xG
xG is a pre-shot model: it scores the chance before the ball is struck. xGoT is a post-shot model: it only exists for shots on target and scores how good the shot itself was. Take Haaland with an empty net: the chance might be 0.75 xG, but if he scuffs it wide, the xGoT is zero because it never troubled the target. Compare the two and you learn about finishing.
Shooting Performance (SP)
This is simply xGoT minus xG. Positive means the player struck the ball better than the chance deserved. Negative means the opposite. If a player is one-on-one with the keeper at 0.71 xG but drags a weak shot worth 0.21 xGoT, that is a shooting performance of -0.50.
Expected Points (xPTS)
xPTS rolls xG up to the league table. It answers "how many points should this team have, given the chances they created and conceded?" and gives you an alternative, luck-adjusted standings view.
How to get xG data from the API
xG data is available through an expected-goals add-on on your subscription. Once it is enabled on your plan, you retrieve it two ways: as team-level totals per fixture, or broken down per player.
Step 1: Get your API token
Sign up and generate a token at my.sportmonks.com. Provisioning is instant and self-serve, so there is no sales call between you and your first request. There is a free tier to test against.
Step 2: Choose your endpoint
Two dedicated endpoints return expected data directly:
GET https://api.sportmonks.com/v3/football/expected/fixtures    # team-level xG per fixture
GET https://api.sportmonks.com/v3/football/expected/lineups     # player-level xG per fixture
Authenticate with your token as a query parameter (or a bearer token in the header):
https://api.sportmonks.com/v3/football/expected/fixtures?api_token=YOUR_API_TOKENStep 3: Or pull xG inline with a fixture
If you are already requesting fixtures or livescores, you do not need a separate call. Add xG as an include:
# team / fixture xG
https://api.sportmonks.com/v3/football/fixtures/{fixture_id}?api_token=YOUR_API_TOKEN&include=xGFixture

# player-level xG
https://api.sportmonks.com/v3/football/fixtures/{fixture_id}?api_token=YOUR_API_TOKEN&include=lineups.xGLineup
Append .type to expand the metadata for each metric (its name and code), so you do not have to map type_ids yourself.
Step 4: Read the response
The expected/fixtures endpoint returns one row per metric per team, keyed by type_id, with the value under data.value and a location of home or away:
{
  "data": [
    { "id": 26898369, "fixture_id": 18898173, "type_id": 5304, "participant_id": 10010, "data": { "value": 1.0674 }, "location": "home" },
    { "id": 26898370, "fixture_id": 18898173, "type_id": 5304, "participant_id": 7011,  "data": { "value": 1.8234 }, "location": "away" }
  ]
}
Here type_id: 5304 is xG. Swap in any identifier from the table above to read a different metric.
A full team-level breakdown for one fixture looks like this. Take Wolves (home) versus Arsenal (away):
| Metric (type_id) | Arsenal | Wolves |
|---|---|---|
| xG (5304) | 1.7954 | 0.2347 |
| xGoT (5305) | 2.1182 | 0.6839 |
| npxG (7943) | 1.7954 | 0.2347 |
| xGOP (7945) | 1.5720 | 0.2110 |
| xGSP (7944) | 0.2220 | 0.0230 |
| xG corners (7942) | 0.0730 | 0.0230 |
| xPTS (7939) | 2.49 | 0.32 |
| SP (9685) | 0.3228 | 0.4492 |
| xGP prevented (9686) | 0.6839 | 0.1182 |
| xGA (9687) | 0.2347 | 1.7954 |
| xGD (9684) | 1.5607 | -1.5607 |
Read straight off the table: Arsenal created 1.80 xG worth of chances to Wolves' 0.23, their expected points for the game were 2.49 versus 0.32, and their expected goal difference was +1.56. That is a dominant chance-creation performance, whatever the final score was.
For player-level data, lineups.xGLineup returns the same metric IDs nested per player, so you can see who generated the xG. In that same match Saka carried 0.4093 xG, Ødegaard 0.2048. Players who did not take a shot simply return an empty array.
What you can build with xG
xG is a feature, not a finished product, which is what makes it useful across very different apps:
- Analytics dashboards and media: team and player xG timelines, shot maps, and xG-versus-actual charts. Scoreplay, an AI media-management platform, integrates the API to pull player profiles and match data automatically.
- Betting and fantasy models: xG and xGoT are strong inputs for pricing, form, and value detection, because they capture underlying performance that raw goals miss.
- Scouting and recruitment: npxG per 90 and shooting performance help separate genuinely good finishers and chance-creators from players riding variance.
- Live products: with the real-time add-on, ShiftOneZero builds live xG features into apps for clubs like Dinamo Zagreb.
Using xG in a predictive model
xG itself is descriptive, but it is one of the best available inputs for models that are predictive. A typical workflow:
- Collect team and player xG across matches from the expected endpoints.
- Engineer features: recent xG form, home and away splits, xGA trends, availability of key players.
- Choose a model: logistic regression as a baseline, then random forests or gradient boosting.
- Train, test, and evaluate on accuracy, precision, recall, and F1.
- Deploy for match-outcome estimates, team-strength ratings, or tournament simulations.
If you would rather not build and maintain your own model, the Predictions API already returns match-outcome probabilities, and you can use xG alongside it as an explanatory layer.
Turn "they should have scored" into a query
Every metric above comes from one API, in one uniform format across every covered league. Generate a token, add the expected-goals add-on, and your first xG call takes minutes. If you get stuck, you talk to a real person on our team, not a ticket number.
xG turns "they should have scored" into something you can query, chart, and model. Now you know what every number means and exactly how to get it.
Frequently asked questions
How often is xG updated during a live match?
It refreshes every couple of minutes as the match data is processed. The gap between updates should not exceed about five minutes.
Does every league have xG?
No. xG coverage is broad but not complete across all of the 2,500+ leagues. Check the coverage list in the docs for the leagues you need before you commit.
Is a higher xG a guarantee the team was better?
It tells you they created the better chances. It does not tell you they deserved the three points, and it is not a forecast of the result. For that, use the Predictions API.
What is the difference between xG and xGoT?
xG scores the chance before the shot. xGoT scores the shot itself, and only exists for shots on target. The gap between them is finishing quality (Shooting Performance).
Can I get xG per player, not just per team?
Yes. Use the expected/lineups endpoint or the lineups.xGLineup include to get metrics broken down per player in the lineup.

Written by Wesley Van Rooij
Wesley van Rooij is a marketing and football expert with over 5 years of industry experience. His comprehensive knowledge of the Sportmonks Football API and a focused approach to APIs in the Sports Data industry allow him to offer insights and support to enthusiasts and businesses. His outstanding marketing and communication skills and technical writing expertise enable him to empathise with developers. He understands their needs and challenges to facilitate the development of cutting-edge football applications that stand out in the market.

![Football APIs: How to select the right football data provider [2026]](https://www.sportmonks.com/wp-content/uploads/2020/11/BLOG-How-to-select-the-right-football-data-provider-2025-2-scaled.webp)