Contents
Types of match analytics
Match analytics uses real data to break down a football match, offering a clear and objective understanding of what happens on the pitch. To dive deeper, match analytics covers various approaches that often overlap, providing a comprehensive view of the game. Below, we look at four main types of analysis commonly used in football.
Tactical analysis
Tactical Analysis examines the strategies and approaches teams employ during a single match to outmaneuver their opponents.
Attacking tactics: This involves studying how teams create scoring opportunities. This look at:
– Passing patterns and combinations that break down defences.
– Movement of attacking players, such as runs behind the backline or off-ball positioning.
– Crossing and finishing techniques that convert chances into goals.
– Counter-attacking strategies to exploit transitions.
– Set-piece routines (attacking), like rehearsed corner or free-kick plays.
Defensive tactics: On the flip side, this analyses how teams prevent goals, including:
– Formations and defensive lines (e.g., 4-4-2, 5-3-2) that shape the team’s structure.
– Pressing strategies, such as high press, mid-block, or low block, to disrupt opponents.
– Tackling and interception techniques to regain possession.
– Covering and marking of opponents to neutralise threats.
– Set-piece routines (defending) to thwart rehearsed plays.
In-game adjustments: Teams don’t stick to one plan. This looks at:
– Formation changes mid-match (e.g., switching to a back three).
– Shifts in playing style, like adopting a more attacking or defensive posture.
– Player role adjustments to exploit weaknesses or shore up vulnerabilities.
Substitution analysis: Substitutions can shift momentum. This assess:
– Timing of substitutions and their effect on the game’s flow.
– Player roles and contributions after coming on (e.g., adding pace or defensive solidity).
– Tactical changes tied to substitutes, such as altering the formation.
Tactical Analysis helps coaches understand how to optimise strategies, adapt in real-time, and maximise scoring chances while minimising defensive risks.
Performance analysis
Performance analysis evaluates how well individuals and teams execute their roles, using statistical metrics to measure effectiveness.
Individual player metrics: This tracks key performance indicators, such as:
– Goals, assists, shots, passes, tackles, and interceptions.
– Physical outputs like distance covered, sprints, and top speed.
– Technical skills, including dribbling success rate and aerial duel success rate.
– Passing stats, such as completion rate and key passes that create opportunities.
Team performance metrics: At the collective level, it measure:
– Goals scored and conceded as markers of offensive and defensive success.
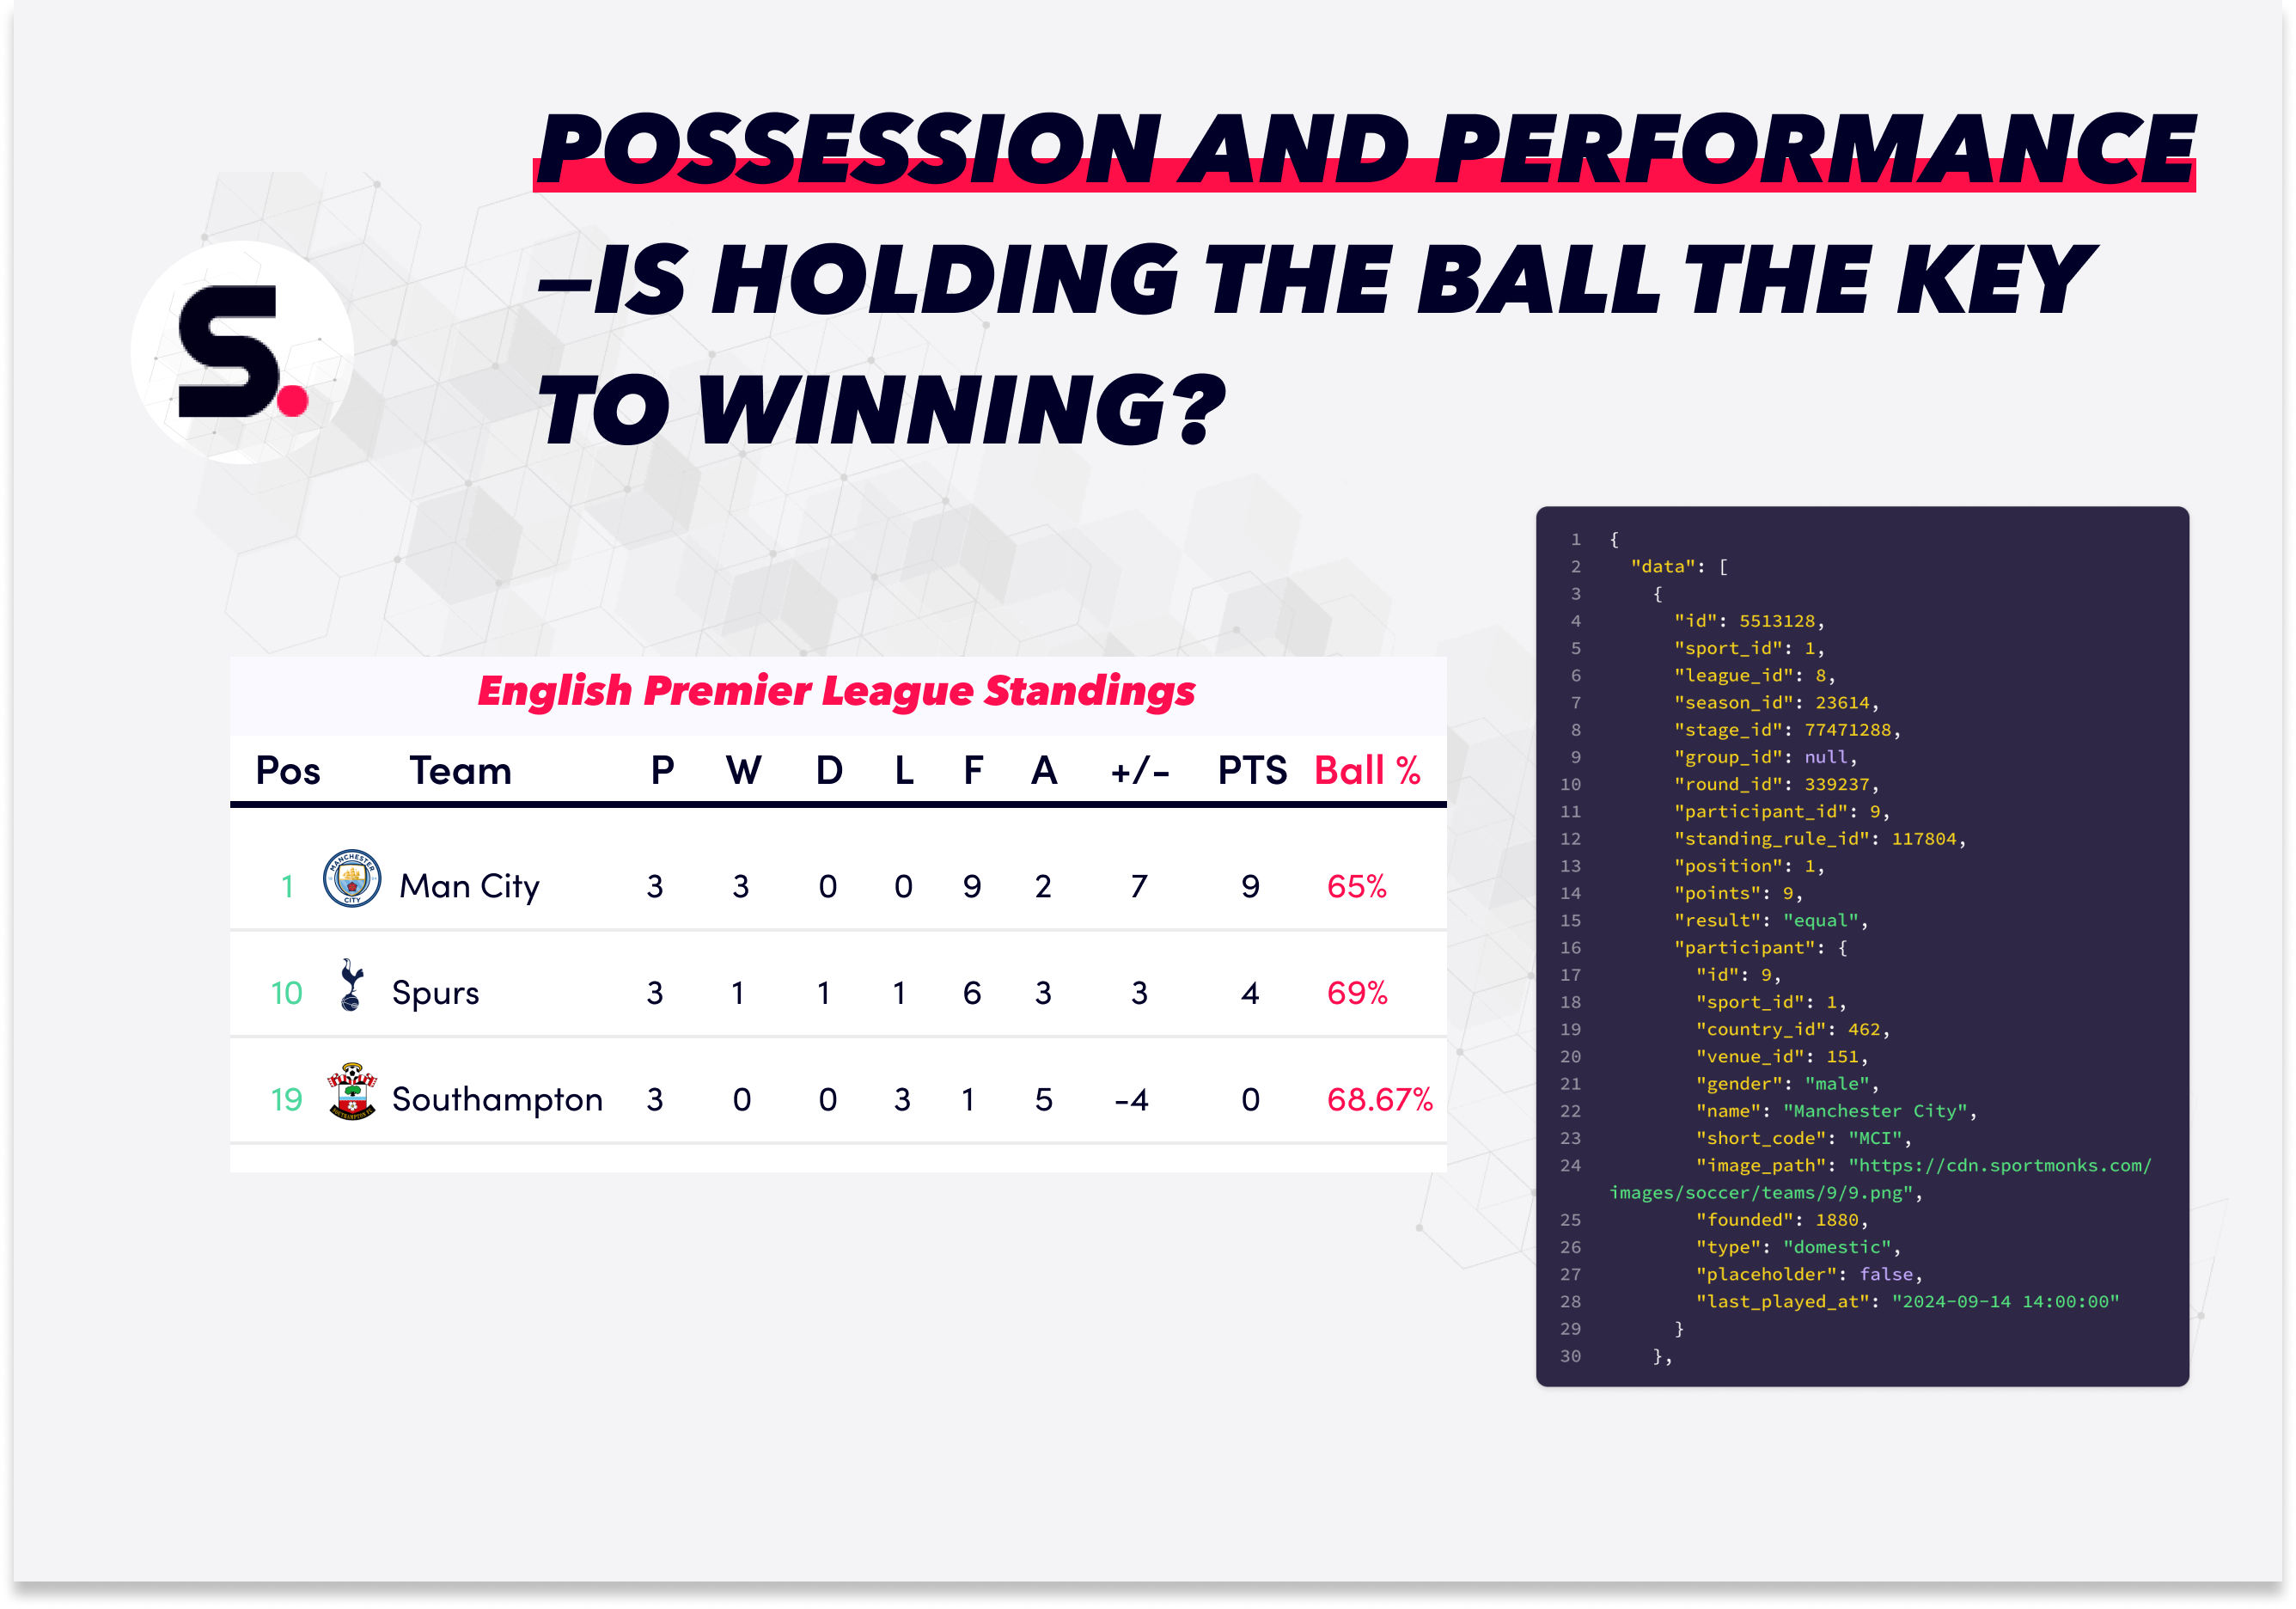
– Possession percentage and pass accuracy to gauge control of the game.
– Shots on target and chances created to assess attacking threat.
– Tackles won, interceptions, and clean sheets to evaluate defensive resilience.
By highlighting strengths and weaknesses, Performance analysis guides player development, informs training priorities, and shapes team selection.
Set-piece analysis
Set-piece analysis looks at the effectiveness of set-pieces—corners, free kicks, and throw-ins—both in attack and defense.
Attacking set-pieces: This looks at how teams capitalise on dead-ball situations:
– Types of routines, such as short corners or in-swinging crosses.
– Player positioning and movement to create space or exploit mismatches.
– Success rates of different routines, measuring goals or chances created.
Defending set-pieces: Defensively, it assesses:
– Defensive formations and marking schemes (e.g., man-marking vs. zonal).
– Effectiveness of clearing headers and dealing with crosses.
– Goals conceded from set-pieces, identifying vulnerabilities.
With set-pieces often deciding close matches, this analysis helps teams refine routines and bolster defensive organisation to gain an edge.
Video analysis
Video Analysis serves as a vital tool that supports all other types of analysis by adding visual context to the numbers.
– Event tagging: Analysts identify and tag key moments, such as goals, assists, tackles, or fouls, for detailed review.
– Player movement tracking: This tracks runs, positioning, and interactions to understand spatial dynamics.
– Tactical pattern recognition: It detects recurring patterns, like a team’s tendency to build play through wide areas or press high up the pitch.
By combining video with statistical data, video analysis provides a richer, clearer understanding of player and team behaviors, improving decision-making.
How match analytics is performed
Match analytics is a step-by-step process that turns raw data into actionable insights. Here’s how it works in simple terms:
Collecting data
– Live event data: Real-time info is captured during the match using tools like optical tracking systems and manual event logging. This data covers player positions, ball movements, passes, tackles, shots, and more.
– Video footage: Recordings from multiple camera angles offer a visual record of the action, helping to put the numbers into context.
– Scouting reports: Observations from scouts who watch the game provide qualitative insights that complement the raw data.
Processing and cleaning data
Raw data isn’t perfect. It needs to be cleaned—errors are corrected, missing details filled in, and formats standardised—to ensure accuracy and consistency.
- Analysing the data: To understand the data, analysts use several key methods. First, they perform statistical analysis, calculating metrics such as pass completion rates, shot accuracy, and tackle success to identify performance trends. Visualisations, like charts and graphs, are then created to simplify complex data. Analysts also combine video footage with statistical analysis to provide context and gain a deeper understanding of the numbers. Finally, machine learning algorithms are employed to recognise patterns and even forecast potential outcomes.
- Interpreting insights: The real value comes when experts interpret the analysis. By using their football knowledge, analysts explain why certain patterns appear and what they mean for team and player performance.
- Communicating and applying findings: Insights are only useful if they’re shared effectively. Whether through detailed reports, presentations, or interactive dashboards, the findings help coaches, players, and decision-makers adjust tactics, plan player development, and refine recruitment strategies.
- Review and iteration: Match analytics isn’t a one-off task. Teams continually review their performance, analyse opponents, and update their strategies based on new insights—making it an ongoing cycle of improvement.
Sportmonks simplifies this process by tracking match details in a way that’s easy to use. Want to see who’s controlling the game or making key plays? We’ve got live stats, possession breakdowns, and simple numbers like shots and passes to show how teams and players perform—whether it’s dominating possession or defending tight. With the European Plan at €39 monthly for 27 leagues, the Worldwide Plan at €129 monthly for 111 leagues, the Enterprise Plan with custom pricing for over 2,200 leagues, or a Custom Plan built for your needs, you’ll get the full story. Check it out at Sportmonks Football API Plans.
Tools and technologies used in match analytics
Match analytics isn’t magic—it’s all about using the right tools to turn raw data into clear insights. Over the years, these tools have evolved, making it easier to understand every move on the pitch. Here’s a breakdown:
Collecting the data
– Tracking systems: Optical cameras and wearable devices (like GPS trackers) capture every move—players’ runs, ball speed, and positioning. This info helps quantify performance and uncover tactical trends.
– Video analysis software: Platforms such as Hudl and Wyscout let you review game footage, tag key events, and create clips. Video adds context to the numbers, showing exactly how and why things happened.
Processing and analysing the data
– Statistical tools: Languages like R and Python help crunch the numbers, calculate metrics, and build models that reveal hidden patterns and trends.
– Data visualisation: Tools like Tableau and Power BI turn complex stats into interactive charts and dashboards, making it easier to share insights with coaches, players, and fans.
– All-in-one analytics platforms: Integrated systems combine data collection, processing, and visualisation into one smooth workflow—so you spend less time juggling different tools and more time making smart decisions.
Sharing the insights
– Presentation software: Tools like PowerPoint or Google Slides help package your findings in a clear, engaging format that’s easy to understand.
– Collaboration platforms: Apps like Slack and Microsoft Teams make it simple to share data, discuss ideas, and work as a team—ensuring everyone stays on the same page.
Cutting-edge technologies
– Machine learning & AI: These technologies can automatically spot patterns and even predict outcomes, adding a new level of sophistication to match analysis.
– Computer vision: This tech automates event detection in video footage, reducing manual work and speeding up the process of turning video into actionable insights.
FAQs about match analytics
- Collect data: Gather live event data (passes, shots, tackles) using tracking systems, video footage from multiple angles, and scouting reports.
- Process data: Clean and standardise the raw data to ensure accuracy, correcting errors and filling in gaps.
- Analyse data: Use statistical tools (e.g., R, Python) to calculate metrics like pass completion or shot accuracy, visualise trends with tools like Tableau, and combine with video for context. Machine learning can also identify patterns.
- Interpret insights: Apply football expertise to explain the data, focusing on tactical successes, player performance, and areas for improvement.
- Communicate findings: Share results via reports, presentations, or dashboards to inform tactical adjustments and player development.
- Review: Continuously refine analysis based on new matches and opponents, as outlined in the Sportmonks process.